Gold Price Analysis: XAU/USD battles 200-SMA on 4H chart, US stimulus, Fed eyed


  • Gold surges after a descending triangle breakout on the 4H chart.
  • 200-SMA challenges bull’s commitment above $1850.
  •  Markets await the Fed and a likely US fiscal stimulus deal.

Gold (XAU/USD) consolidates Tuesday’s surge, trading close to the weekly tops just below the $1860 barrier.

The yellow metal rallied nearly 1% a day before and now looks to build on the upside amid rising expectations that the US lawmakers will clinch the much-awaited coronavirus relief aid package.

However, the XAU bulls remain mindful of the Fed decision due later on Wednesday, with likely upbeat projections from the American central bank seen hurting the sentiment around gold.

From a technical perspective, the four-hour (4H) chart shows that gold is struggling to recapture the horizontal 200-simple moving average (SMA) at $1859.

Acceptance above the latter could prompt the bulls to resume its upbeat momentum, in the wake of a descending triangle breakout confirmed early Tuesday.

Gold Price Chart: Four-hour 

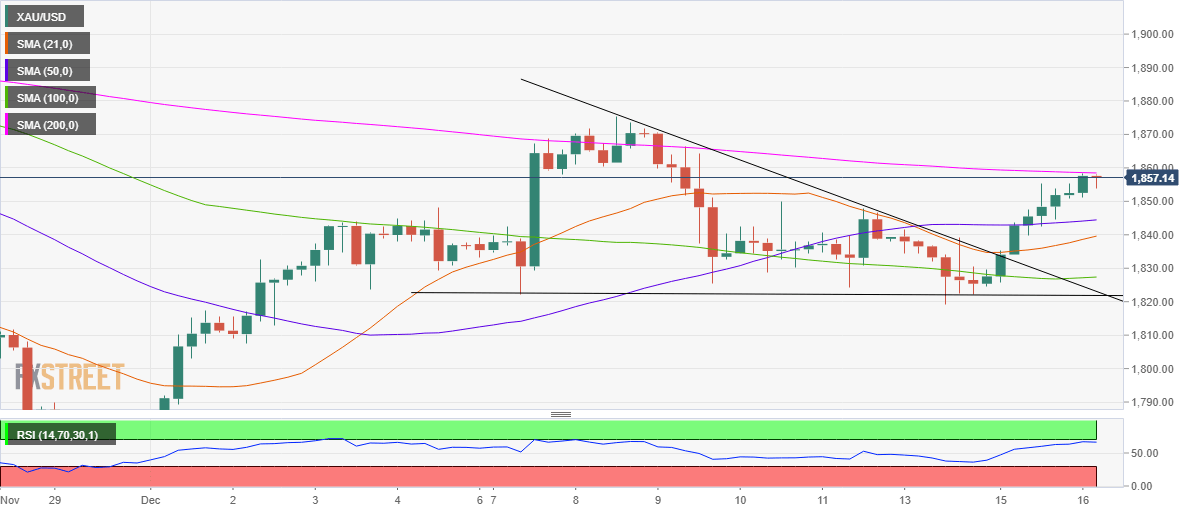
The next relevant resistance is seen at $1875, the December 8 high. The bulls could then eye a test of the $1900 mark.

The Relative Strength Index (RSI) sits beneath the overbought territory, near 67.00, suggesting that there is scope for further upside.

On the flip side, the horizontal 50-SMA at $1845 could be back on the sellers’ radars. That level was the previous crucial resistance.

Further south, the 21-SMA support at $1840 could likely be probed.

Gold Additional levels

XAU/USD

Overview
Today last price 1856.10
Today Daily Change 1.57
Today Daily Change % 0.08
Today daily open 1854.52
 
Trends
Daily SMA20 1834.31
Daily SMA50 1872.81
Daily SMA100 1908.08
Daily SMA200 1810.98
 
Levels
Previous Daily High 1855.47
Previous Daily Low 1825.59
Previous Weekly High 1875.34
Previous Weekly Low 1822.22
Previous Monthly High 1965.58
Previous Monthly Low 1764.6
Daily Fibonacci 38.2% 1844.06
Daily Fibonacci 61.8% 1837
Daily Pivot Point S1 1834.92
Daily Pivot Point S2 1815.31
Daily Pivot Point S3 1805.04
Daily Pivot Point R1 1864.8
Daily Pivot Point R2 1875.07
Daily Pivot Point R3 1894.68


Share: Feed news

Information on these pages contains forward-looking statements that involve risks and uncertainties. Markets and instruments profiled on this page are for informational purposes only and should not in any way come across as a recommendation to buy or sell in these assets. You should do your own thorough research before making any investment decisions. FXStreet does not in any way guarantee that this information is free from mistakes, errors, or material misstatements. It also does not guarantee that this information is of a timely nature. Investing in Open Markets involves a great deal of risk, including the loss of all or a portion of your investment, as well as emotional distress. All risks, losses and costs associated with investing, including total loss of principal, are your responsibility. The views and opinions expressed in this article are those of the authors and do not necessarily reflect the official policy or position of FXStreet nor its advertisers. The author will not be held responsible for information that is found at the end of links posted on this page.

If not otherwise explicitly mentioned in the body of the article, at the time of writing, the author has no position in any stock mentioned in this article and no business relationship with any company mentioned. The author has not received compensation for writing this article, other than from FXStreet.

FXStreet and the author do not provide personalized recommendations. The author makes no representations as to the accuracy, completeness, or suitability of this information. FXStreet and the author will not be liable for any errors, omissions or any losses, injuries or damages arising from this information and its display or use. Errors and omissions excepted.

The author and FXStreet are not registered investment advisors and nothing in this article is intended to be investment advice.

Recommended content


Recommended content

Editors’ Picks

EUR/USD nears 1.0800 on broad US Dollar weakness

EUR/USD nears 1.0800 on broad US Dollar weakness

Optimism continues to undermine demand for the American currency ahead of the weekly close. EUR/USD hovers around weekly highs just ahead of the 1.0900 figure.

EUR/USD News

GBP/USD reconquers 1.2500 with upbeat UK GDP

GBP/USD reconquers 1.2500 with upbeat UK GDP

Following BOE-inspired slump on Thursday, the British Pound changed course and trades around 1.2530. Better-than-anticipated UK GDP and a weaker USD behind the advance.

GBP/USD News

Gold resumes advance and trades above $2,370

Gold resumes advance and trades above $2,370

XAU/USD accelerated its recovery on Friday, as investors drop the USD. Dismal US employment-related figures revived hopes for a soon-to-come rate cut from the Fed.

Gold News

XRP tests support at $0.50 as Ripple joins alliance to work on blockchain recovery

XRP tests support at $0.50 as Ripple joins alliance to work on blockchain recovery

XRP trades around $0.5174 early on Friday, wiping out gains from earlier in the week, as Ripple announced it has joined an alliance to support digital asset recovery alongside Hedera and the Algorand Foundation. 

Read more

Euro area annual inflation is expected to be 2.4% in April 2024

Euro area annual inflation is expected to be 2.4% in April 2024

Euro area annual inflation is expected to be 2.4% in April 2024, stable compared to March. Looking at the main components of euro area inflation, services is expected to have the highest annual rate in April.

Read more

Forex MAJORS

Cryptocurrencies

Signatures