|

Gold Price Analysis: Rejection at 50-DMA recalls XAU/USD sellers, $1730 eyed

  • Gold looks to retest $1730 support after retreating from five-week highs.
  • Technical indicators still back the case for the upside.
  • 50-DMA at $1760 is the level to beat for XAU/USD bulls.

Gold (XAU/USD) has returned to the red zone on Friday, having failed to surpass the critical hurdle at $1760 for the second straight session.

That level appears to be the downward-sloping 50-daily moving average (DMA). Sellers are back in control and remain poised to threaten the mildly bullish 21-DMA at $1731.

However, with the 14-day Relative Strength Index (RSI) still defending the midline, the downside appears limited by the abovementioned 21-DMA support.

If the level gives way, the April 5 low at $1721 could be put to test. Further south, the April month low so far at $1706 will be eyed.

Gold Price Chart: One-day


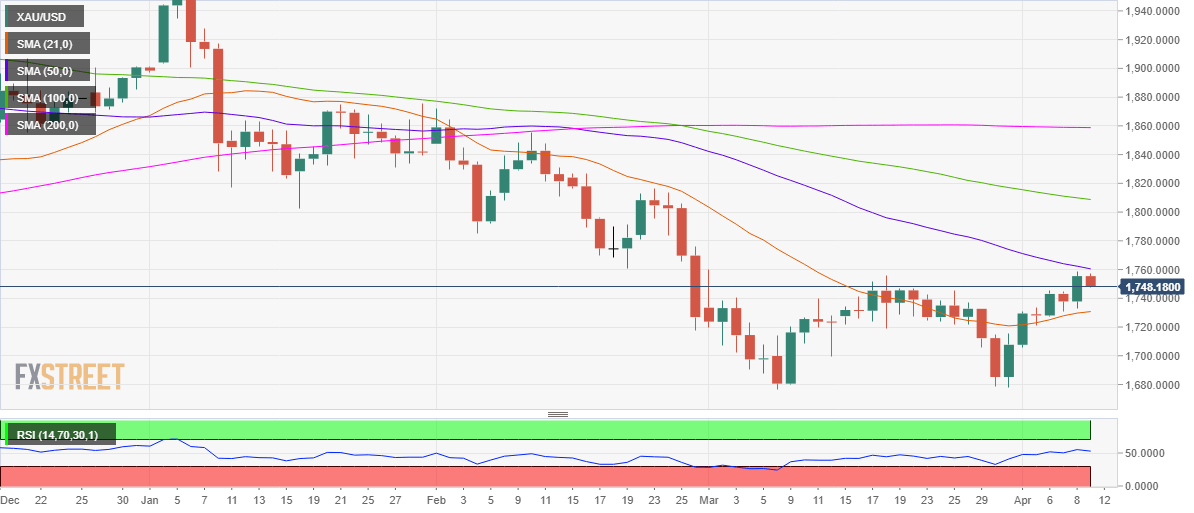
Alternatively, should XAU buyers find acceptance above the powerful 50-DMA resistance on a daily closing basis, the double bottom reversal in gold could likely regain momentum.

Subsequently, a rally towards the $1800 mark cannot be ruled.

Gold: Additional levels

XAU/USD

Overview
Today last price1748.95
Today Daily Change-6.48
Today Daily Change %-0.37
Today daily open1755.42
 
Trends
Daily SMA201729.89
Daily SMA501762.35
Daily SMA1001809.92
Daily SMA2001858.89
 
Levels
Previous Daily High1758.74
Previous Daily Low1733.22
Previous Weekly High1733.24
Previous Weekly Low1677.98
Previous Monthly High1759.98
Previous Monthly Low1676.87
Daily Fibonacci 38.2%1748.99
Daily Fibonacci 61.8%1742.97
Daily Pivot Point S11739.51
Daily Pivot Point S21723.61
Daily Pivot Point S31713.99
Daily Pivot Point R11765.03
Daily Pivot Point R21774.65
Daily Pivot Point R31790.55

Author

Dhwani Mehta

Dhwani Mehta

FXStreet

Residing in Mumbai (India), Dhwani is a Senior Analyst and Manager of the Asian session at FXStreet. She has over 10 years of experience in analyzing and covering the global financial markets, with specialization in Forex and commodities markets.

More from Dhwani Mehta
Share:

Editor's Picks

AUD/USD eyes 0.7150 barrier nine-day EMA

AUD/USD inches higher after registering modest losses in the previous day, trading around 0.7130 during the Asian hours. The technical analysis of the daily chart indicates that the pair is moving sideways within the rectangle pattern, suggesting a consolidation as neither the bulls nor the bears have enough momentum to take control of the market.

USD/JPY trades below 160.00 intervention threshold; bullish bias intact

The USD/JPY pair attracts some sellers during the Asian session amid fears that authorities will step in again to prop up the Japanese Yen. Furthermore, the Israel-Lebanon truce prompts some profit-taking around the US Dollar and exerts downward pressure on the currency pair.

Gold defends 200-day SMA, rises toward $4,500

Gold is attempting a tepid recovery toward $4,500 on Thursday, as renewed optimism in the Mideast geopolitical front calms market nerves. This cautious optimism across Asian markets weighs on Oil prices, and diminishes the US Dollar’s safe-haven appeal, helping Gold stage a decent comeback from the weekly low of $4,424.


Hyperliquid: ETF demand, capital rotation fuel HYPE rally as Bitcoin melts

Hyperliquid price sustains an upward trend near its all-time high of $75.76 on Thursday after posting 80% gains in May, while Bitcoin (BTC) retraces below $65,000, triggering a market-wide panic.

Kevin Warsh takes the Fed helm: What it means for the US Dollar
The Federal Reserve moves away from the highly predictable "forward guidance" model of the Jerome Powell era to a new “Kevin Warsh environment”, characterized by less communication, more policy surprises, and an increased focus on the Fed's complex balance sheet.
Recession on paper: What really moves the Canadian Loonie now?

Statistics Canada handed the headline writers a gift and the analysts a headache. Real GDP shrank 0.1% on an annualized basis in the first quarter, and with the fourth quarter of 2025 revised down to a 1.0% contraction, that is two negative quarters in a row, the textbook definition of a technical recession and Canada's first since the pandemic.