Gold Price Analysis: Recapturing $1857 critical for XAU/USD in the FOMC week ahead – Confluence Detector

Gold (XAU/USD) fell 1% on Friday as risk-off mood and stellar US Markit Manufacturing PMI boosted the US dollar. Despite the decline, the yellow metal managed to close the week above the $1850 level, booking the first weekly gain in three weeks.
Expectations of a massive US fiscal stimulus under the Biden administration kept the sentiment underpinned around the inflation-hedge gold. The passage of the former Fed Chair Janet Yellen’s confirmation as the Treasury Secretary also offered some support to the metal. Yellen had called on the government to ‘act big’ in order to fight the pandemic-recession in her testimony last week.
Attention now turns towards next week’s FOMC decision and the first-tier US economic data fresh trading opportunity in gold. How is gold positioned technically heading into the Fed week?
Gold Price Chart: Key resistances and supports
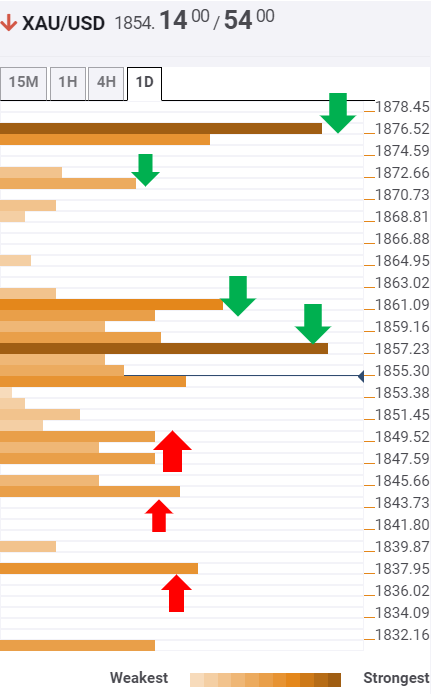
The Technical Confluences Indicator shows that gold could face an initial strong hurdle at $1857 when it opens a new week on Monday. That level is the confluence of the previous high on four-hour and Fibonacci 38.2% one-month.
A cluster of dense upside barrier is located around $1860-$1862, where the SMA50 one-day, Fibonacci 61.8% one-day and SMA10 four-hour converge.
A fresh rally towards the next upside target of $1872 (pivot point one-day R1) could be triggered on an acceptance above the $1860-$1862 range.
Further north, the bulls could then challenge $1875/76 levels, which is the intersection of the Fibonacci 23.6% one-month, the previous week high and SMA100 four-hour.
Alternatively, the confluence of the SMA200 one-hour, SMA50 four-hour and SMA10 one-day around $1849 will likely guard the downside.
A break below the latter could call for a test of a minor $1845 cap, Bollinger Band one-hour Lower.
The next relevant cushion is seen at $1838, where the previous low one-day coincides with the pivot point one-day S1.
Here is how it looks on the tool
About Confluence Detector
The TCI (Technical Confluences Indicator) is a tool to locate and point out those price levels where there is a congestion of indicators, moving averages, Fibonacci levels, Pivot Points, etc. Knowing where these congestion points are located is very useful for the trader, and can be used as a basis for different strategies.
Author

Dhwani Mehta
FXStreet
Residing in Mumbai (India), Dhwani is a Senior Analyst and Manager of the Asian session at FXStreet. She has over 10 years of experience in analyzing and covering the global financial markets, with specialization in Forex and commodities markets.


