|

Gold Price Analysis: Nears descending triangle resistance

  • Gold has carved out a descending triangle on the daily chart. 
  • The yellow metal is currently trading near the upper end of the triangle. 

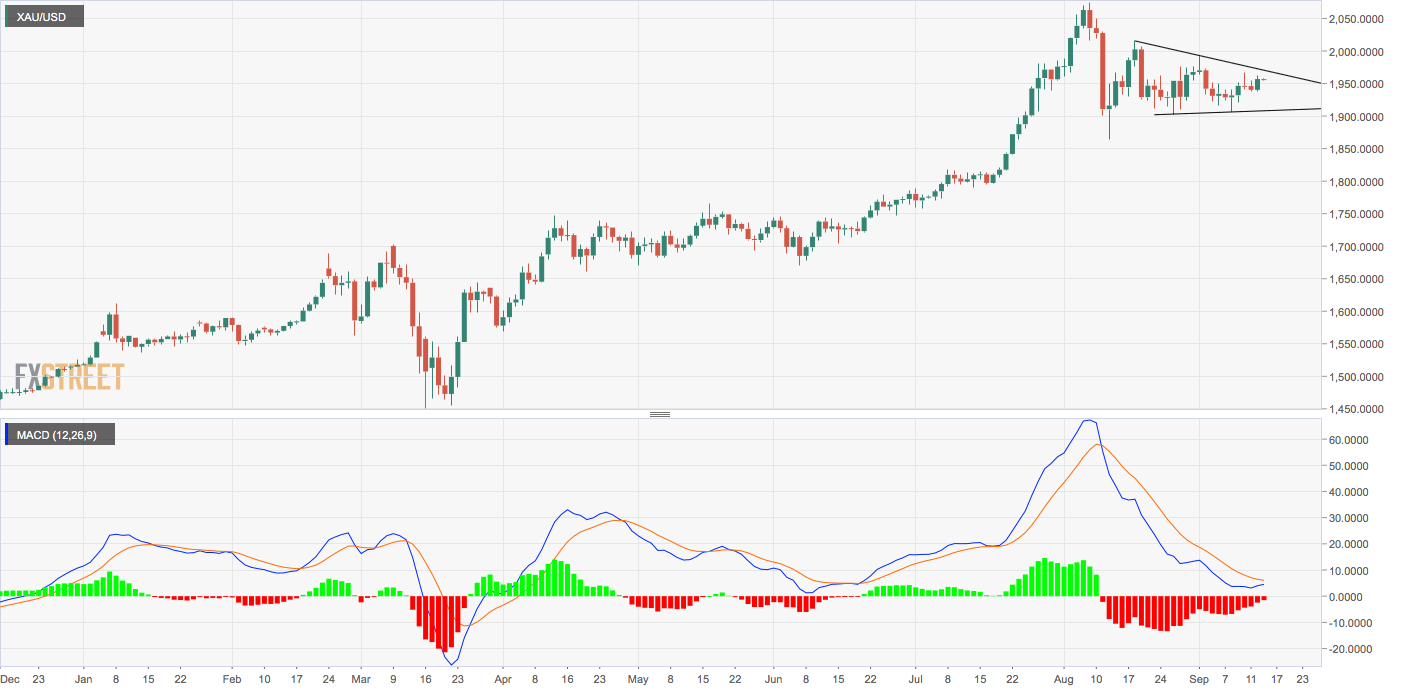
Having jumped 0.89% on Monday, gold is now closing on the upper end of the four-week-long descending triangle pattern seen on the daily chart, 

A close above the triangle resistance, currently at $1,970, would imply revival of the broader uptrend and expose the record high of $2,075 reached on Aug. 7. On the way higher, the yellow metal may encounter resistance at $$1,992 (Sept. 1 high) and $2,016 (Aug. 18 high). 

A breakout looks likely as the MACD histogram has charted higher lows, a sign of weakening of downward momentum. 

On the downside, the triangle support at $1,909 is the level to beat for the bears. At press time, gold is trading near $1,955 per ounce. 

Daily chart

Trend: Bullish above $1,970

Technical levels

XAU/USD

Overview
Today last price1957.71
Today Daily Change0.91
Today Daily Change %0.05
Today daily open1956.8
 
Trends
Daily SMA201945.93
Daily SMA501923.08
Daily SMA1001826.49
Daily SMA2001705.03
 
Levels
Previous Daily High1962.6
Previous Daily Low1937.1
Previous Weekly High1966.54
Previous Weekly Low1906.62
Previous Monthly High2075.32
Previous Monthly Low1863.24
Daily Fibonacci 38.2%1952.86
Daily Fibonacci 61.8%1946.84
Daily Pivot Point S11941.73
Daily Pivot Point S21926.67
Daily Pivot Point S31916.23
Daily Pivot Point R11967.23
Daily Pivot Point R21977.67
Daily Pivot Point R31992.73

Author

Omkar Godbole

Omkar Godbole

FXStreet Contributor

Omkar Godbole, editor and analyst, joined FXStreet after four years as a research analyst at several Indian brokerage companies.

More from Omkar Godbole
Share:

Editor's Picks

AUD/USD falls to near 0.7100 after slipping below 50-day EMA

AUD/USD depreciates after registering minor gains in the previous day, trading around 0.7120 during the Asian hours. The technical analysis of the daily chart shows the pair consolidating sideways within a rectangle pattern, as neither bulls nor bears gain control. The AUD/USD pair is holding a slight bearish tone however as it sits beneath both the nine-day and 50-day EMAs.

USD/JPY coiling up around 160.00 amid 'Yentervention' threats

USD/JPY sits glued near 160.00 in Asia on Friday, as the Japanese Yen remains supported by persistent 'Yentervention' threats by Japan's officials. However, the pair's downside remains capped by the Mideast tensions-led risk-off mood and the US Dollar's bullish consolidation.

Gold returns to the red, awaits US NFP

Gold price is looking to test the weekly lows, while in the red near $4,450 in the early European session on Friday. The precious metal remains vulnerable amid ongoing geopolitical turmoil. Traders will closely monitor the developments surrounding the US-Iran peace deal and the US May employment report later on Friday.


Indian Rupee jumps as RBI holds, but unveils measures to boost foreign inflows

The Reserve Bank of India held the Repo Rate at 5.25%, as widely expected, on Friday. But the central bank unveiled various measures to boost foreign inflows into the economy, lifting the Indian Rupee against the US Dollar.

Top 3 Price Prediction: Bitcoin eyes $60,000, Ethereum risks $1,750, XRP could test $1

Bitcoin, Ethereum, and Ripple prices edge lower on Friday, extending a steady decline of roughly 15% so far this week. Institutional outflows weigh on Bitcoin and Ethereum while XRP largely follows the broader market trend.

Recession on paper: What really moves the Canadian Loonie now?

Statistics Canada handed the headline writers a gift and the analysts a headache. Real GDP shrank 0.1% on an annualized basis in the first quarter, and with the fourth quarter of 2025 revised down to a 1.0% contraction, that is two negative quarters in a row, the textbook definition of a technical recession and Canada's first since the pandemic.