Gold Price Analysis: Doors still ajar for $1934 while XAU/USD holds onto $1909 – Confluence Detector


Safe-haven US dollar is back in demand on Thursday amid fading hopes of a US fiscal deal and election interference risk. The market mood soured after top American intelligence officials warned that Iran and Russia could be trying to disrupt the upcoming Presidential election.

Meanwhile, President Donald Trump’s accusations of the Democrats unwilling to reach an agreement on the multi-trillion-dollar fiscal aid raised doubts over the further stimulus talks. Amid jittery markets, the dollar stands tall, although technically the XAU bulls still insist, keeping the sentiment buoyed around gold.

Gold: Key resistances and supports

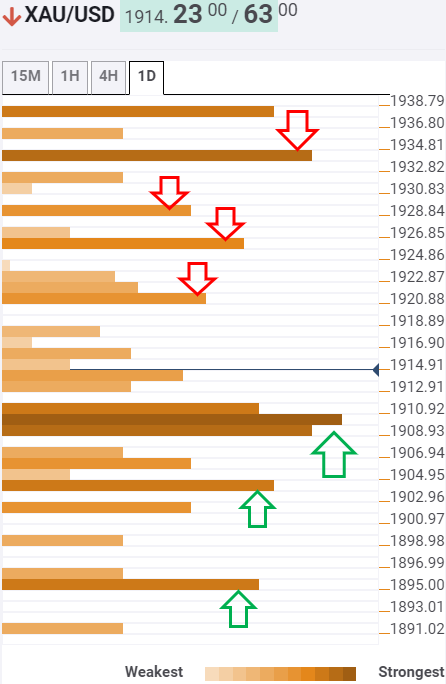
The Technical Confluences Indicator shows that a bunch of healthy resistance and support levels are stacked up for the bright metal. However, the path of minimum resistance appears to the upside.

The XAU bulls march towards the next significant resistance at $1920, the confluence of the SMA5 four-hour and SMA100 15-minutes.

A break above the latter would expose the Fibonacci 23.6% one-day level placed at $1925. If the price surges past that level, $1928 (pivot point one-week R1) will offer immediate resistance.

Further north, the Fibonacci 61.8% one-month at $1938 is the level to beat for the bulls.

Alternatively, a dense cluster of supports around $1909 continues to guard the downside. That level is the convergence of the pivot point one-day S1, SMA200 one-hour and SMA50 four-hour.

The next downside target is set at $1904, the Fibonacci 38.2% one-month, acceptance below which could trigger a drop towards the $1896 support zone. At that level, the Fibonacci 23.6% one-week and Bollinger Band four-hour Lower coincide.

Here is how it looks on the tool

fxsoriginal


About Confluence Detector

The Confluence Detector finds exciting opportunities using Technical Confluences. The TC is a tool to locate and point out those price levels where there is a congestion of indicators, moving averages, Fibonacci levels, Pivot Points, etc. Knowing where these congestion points are located is very useful for the trader, and can be used as a basis for different strategies.

Learn more about Technical Confluence


Share: Feed news

Information on these pages contains forward-looking statements that involve risks and uncertainties. Markets and instruments profiled on this page are for informational purposes only and should not in any way come across as a recommendation to buy or sell in these assets. You should do your own thorough research before making any investment decisions. FXStreet does not in any way guarantee that this information is free from mistakes, errors, or material misstatements. It also does not guarantee that this information is of a timely nature. Investing in Open Markets involves a great deal of risk, including the loss of all or a portion of your investment, as well as emotional distress. All risks, losses and costs associated with investing, including total loss of principal, are your responsibility. The views and opinions expressed in this article are those of the authors and do not necessarily reflect the official policy or position of FXStreet nor its advertisers. The author will not be held responsible for information that is found at the end of links posted on this page.

If not otherwise explicitly mentioned in the body of the article, at the time of writing, the author has no position in any stock mentioned in this article and no business relationship with any company mentioned. The author has not received compensation for writing this article, other than from FXStreet.

FXStreet and the author do not provide personalized recommendations. The author makes no representations as to the accuracy, completeness, or suitability of this information. FXStreet and the author will not be liable for any errors, omissions or any losses, injuries or damages arising from this information and its display or use. Errors and omissions excepted.

The author and FXStreet are not registered investment advisors and nothing in this article is intended to be investment advice.

Recommended content


Recommended content

Editors’ Picks

EUR/USD edges lower toward 1.0700 post-US PCE

EUR/USD edges lower toward 1.0700 post-US PCE

EUR/USD stays under modest bearish pressure but manages to hold above 1.0700 in the American session on Friday. The US Dollar (USD) gathers strength against its rivals after the stronger-than-forecast PCE inflation data, not allowing the pair to gain traction.

EUR/USD News

GBP/USD retreats to 1.2500 on renewed USD strength

GBP/USD retreats to 1.2500 on renewed USD strength

GBP/USD lost its traction and turned negative on the day near 1.2500. Following the stronger-than-expected PCE inflation readings from the US, the USD stays resilient and makes it difficult for the pair to gather recovery momentum.

GBP/USD News

Gold struggles to hold above $2,350 following US inflation

Gold struggles to hold above $2,350 following US inflation

Gold turned south and declined toward $2,340, erasing a large portion of its daily gains, as the USD benefited from PCE inflation data. The benchmark 10-year US yield, however, stays in negative territory and helps XAU/USD limit its losses. 

Gold News

Bitcoin Weekly Forecast: BTC’s next breakout could propel it to $80,000 Premium

Bitcoin Weekly Forecast: BTC’s next breakout could propel it to $80,000

Bitcoin’s recent price consolidation could be nearing its end as technical indicators and on-chain metrics suggest a potential upward breakout. However, this move would not be straightforward and could punish impatient investors. 

Read more

Week ahead – Hawkish risk as Fed and NFP on tap, Eurozone data eyed too

Week ahead – Hawkish risk as Fed and NFP on tap, Eurozone data eyed too

Fed meets on Wednesday as US inflation stays elevated. Will Friday’s jobs report bring relief or more angst for the markets? Eurozone flash GDP and CPI numbers in focus for the Euro.

Read more

Forex MAJORS

Cryptocurrencies

Signatures