- Gold bears in full control below a critical old support structure.
- There is room for a 61.8% Fibonacci retracement for a strong resistance confluence.
- With eyes on the Fed, bulls remain on the sidelines, expecting higher prices, eventually.
The price of gold has been on the back foot this week, breaking below the psychological $1,850s area, plummeting to a fresh weekly low of $1,800.40.
Meanwhile, with the Dow above 30,000 and the S&P500 closing at a fresh all-time high this week, there is limited upside for gold in the near-term due to the combination of the vaccine news and the beginning of the Biden transition.
Today, the spot market is consolidated between $1,805.99 and $1,818.23 where it meets the old July resistance and Thanksgiving holidays in the US.
''The recent capitulation in gold will likely mark the end of the consolidation phase,'' analysts at TD Securities explained.
''The recent liquidations are likely associated with a capitulation in positioning, as a break below support crossed a pain threshold for many.''
''Notwithstanding, we also find that macro headwinds have contributed to liquidations over the past month — after all, nominal rates have risen substantially during that time period, likely contributing to the outflows seen in ETFs,'' the analysts added.
However, going forward, there are prospects for a weaker US dollar which would tend to support gold prices higher.
The focus will be on the Federal Reserve on December 15-16 and whether the adoption of new COVID-related restrictions has added to downside risks for the economy in coming months, in the central bank's view.
''We expect that the Fed will ease by extending the weighted average maturity of its Treasury purchases, ultimately increasing the effectiveness of QE,'' analysts at TD Securities explained.
''As real rates to resume their downward trajectory, we expect investment inflows into precious metals to rise substantially, supporting gold prices north of $2,000/oz. The market will be looking for any discussions on these dimensions of QE in the Fed's Minutes.''
Daily chart
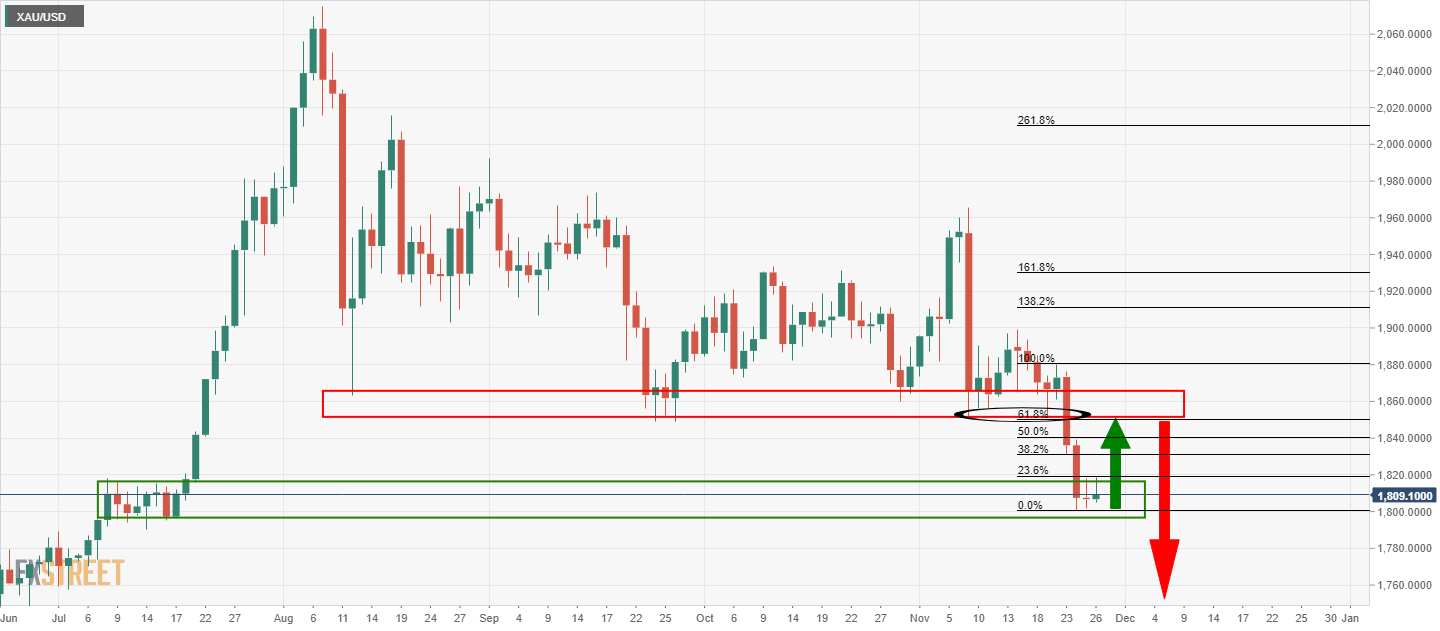
From a technical perspective, the price is moving in an extension of the monthly bearish correction.
The daily chart shows that the price is now below old support that will be expected to act as resistance in a 61.% Fibonacci retracement.
In waiting for the retracement, committed bears will be seeking a discount to target the next lower low.
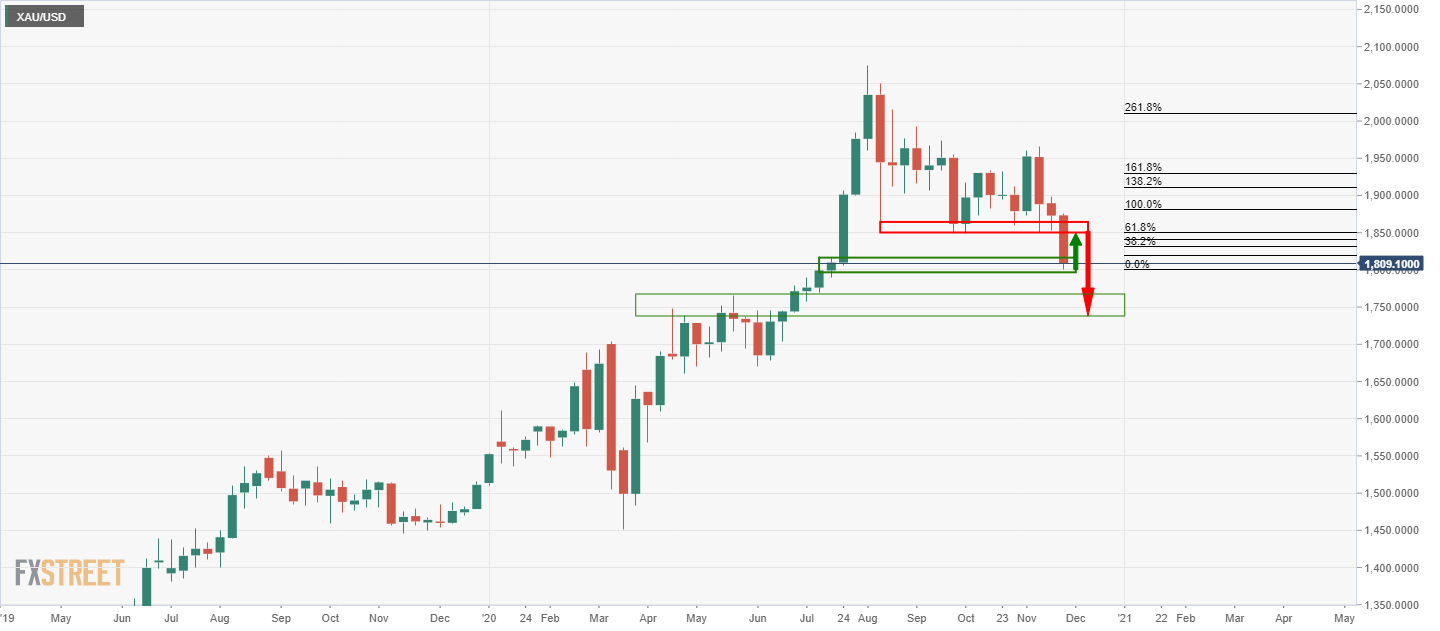
The weekly chart below offers the prospects of a new lower low to an old resistance structure.
Weekly chart
Information on these pages contains forward-looking statements that involve risks and uncertainties. Markets and instruments profiled on this page are for informational purposes only and should not in any way come across as a recommendation to buy or sell in these assets. You should do your own thorough research before making any investment decisions. FXStreet does not in any way guarantee that this information is free from mistakes, errors, or material misstatements. It also does not guarantee that this information is of a timely nature. Investing in Open Markets involves a great deal of risk, including the loss of all or a portion of your investment, as well as emotional distress. All risks, losses and costs associated with investing, including total loss of principal, are your responsibility. The views and opinions expressed in this article are those of the authors and do not necessarily reflect the official policy or position of FXStreet nor its advertisers. The author will not be held responsible for information that is found at the end of links posted on this page.
If not otherwise explicitly mentioned in the body of the article, at the time of writing, the author has no position in any stock mentioned in this article and no business relationship with any company mentioned. The author has not received compensation for writing this article, other than from FXStreet.
FXStreet and the author do not provide personalized recommendations. The author makes no representations as to the accuracy, completeness, or suitability of this information. FXStreet and the author will not be liable for any errors, omissions or any losses, injuries or damages arising from this information and its display or use. Errors and omissions excepted.
The author and FXStreet are not registered investment advisors and nothing in this article is intended to be investment advice.
Recommended content
Editors’ Picks
EUR/USD edges lower toward 1.0700 post-US PCE
EUR/USD stays under modest bearish pressure but manages to hold above 1.0700 in the American session on Friday. The US Dollar (USD) gathers strength against its rivals after the stronger-than-forecast PCE inflation data, not allowing the pair to gain traction.
GBP/USD retreats to 1.2500 on renewed USD strength
GBP/USD lost its traction and turned negative on the day near 1.2500. Following the stronger-than-expected PCE inflation readings from the US, the USD stays resilient and makes it difficult for the pair to gather recovery momentum.
Gold struggles to hold above $2,350 following US inflation
Gold turned south and declined toward $2,340, erasing a large portion of its daily gains, as the USD benefited from PCE inflation data. The benchmark 10-year US yield, however, stays in negative territory and helps XAU/USD limit its losses.
Bitcoin Weekly Forecast: BTC’s next breakout could propel it to $80,000 Premium
Bitcoin’s recent price consolidation could be nearing its end as technical indicators and on-chain metrics suggest a potential upward breakout. However, this move would not be straightforward and could punish impatient investors.
Week ahead – Hawkish risk as Fed and NFP on tap, Eurozone data eyed too
Fed meets on Wednesday as US inflation stays elevated. Will Friday’s jobs report bring relief or more angst for the markets? Eurozone flash GDP and CPI numbers in focus for the Euro.