Gold Price Analysis: Bulls head towards a monthly 50% mean reversion
- XAU/USD is moving deeper into resistance territory.
- Bears are watching for the formation of bearish structure.

Gold remains in the hands of the bulls, but there are prospects of a correction to the downside.
The following is a top dow analysis that illustrates the market structure and potential outcomes.
Monthly chart
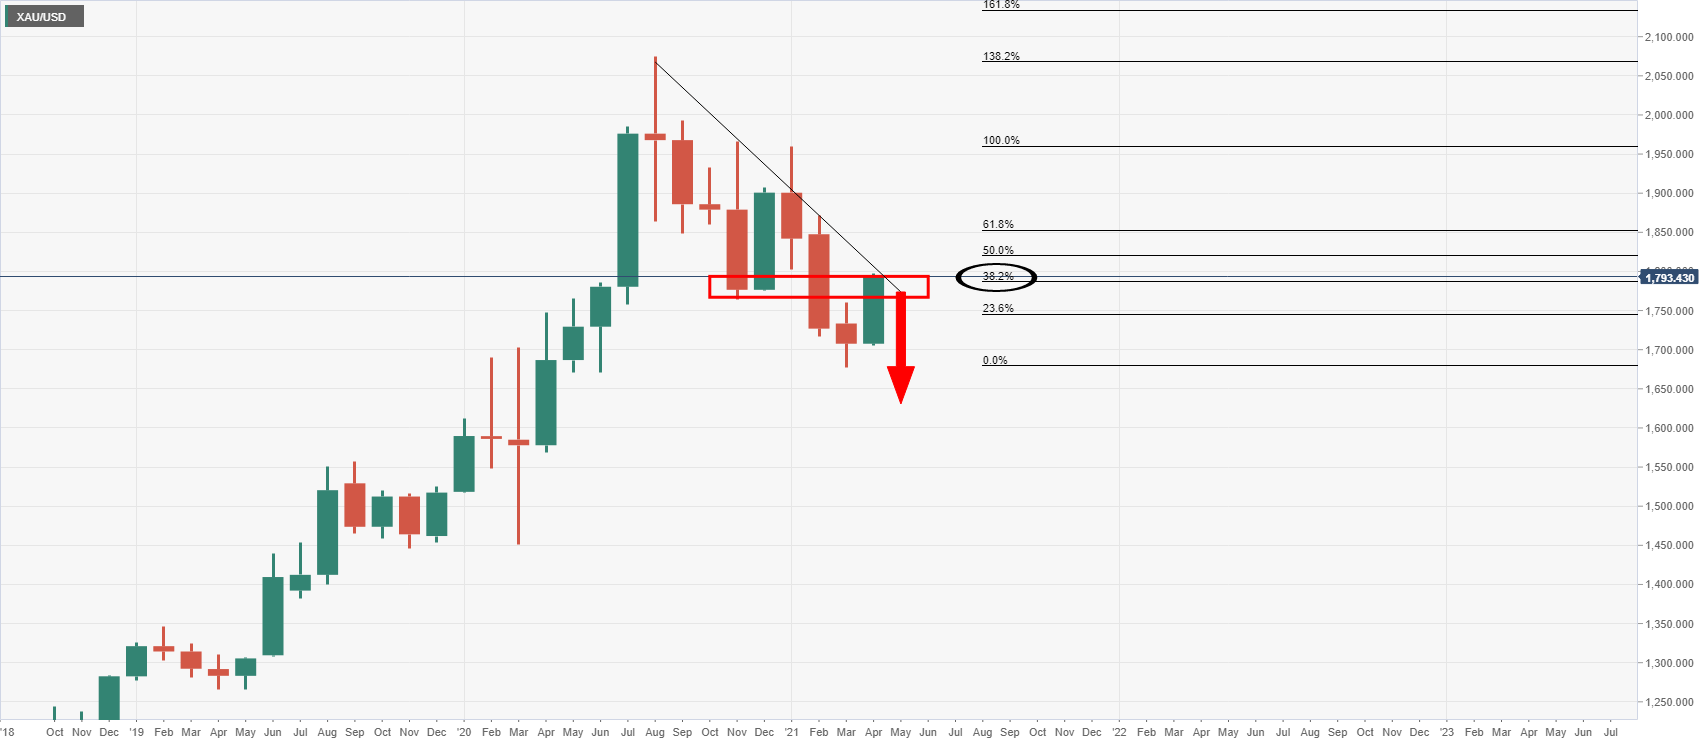
The monthly chart shows the price is meeting a critical resistance zone.
Weekly chart
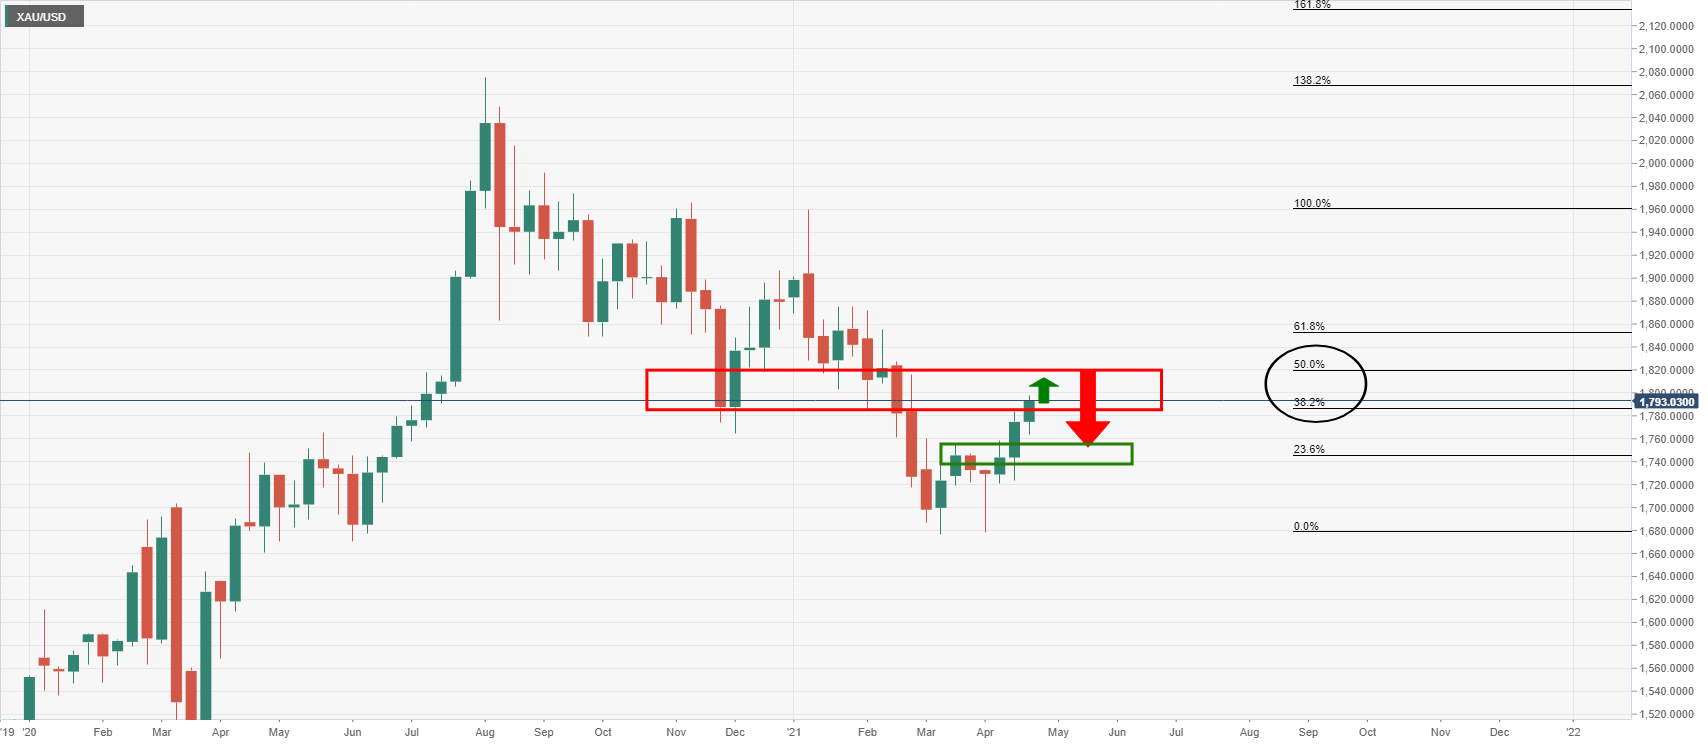
The weekly chart shows that the price is meeting a 38.2% Fibonacci level and the focus is on the prior resistance structure that would be expected to act as support on the downside.
Daily chart
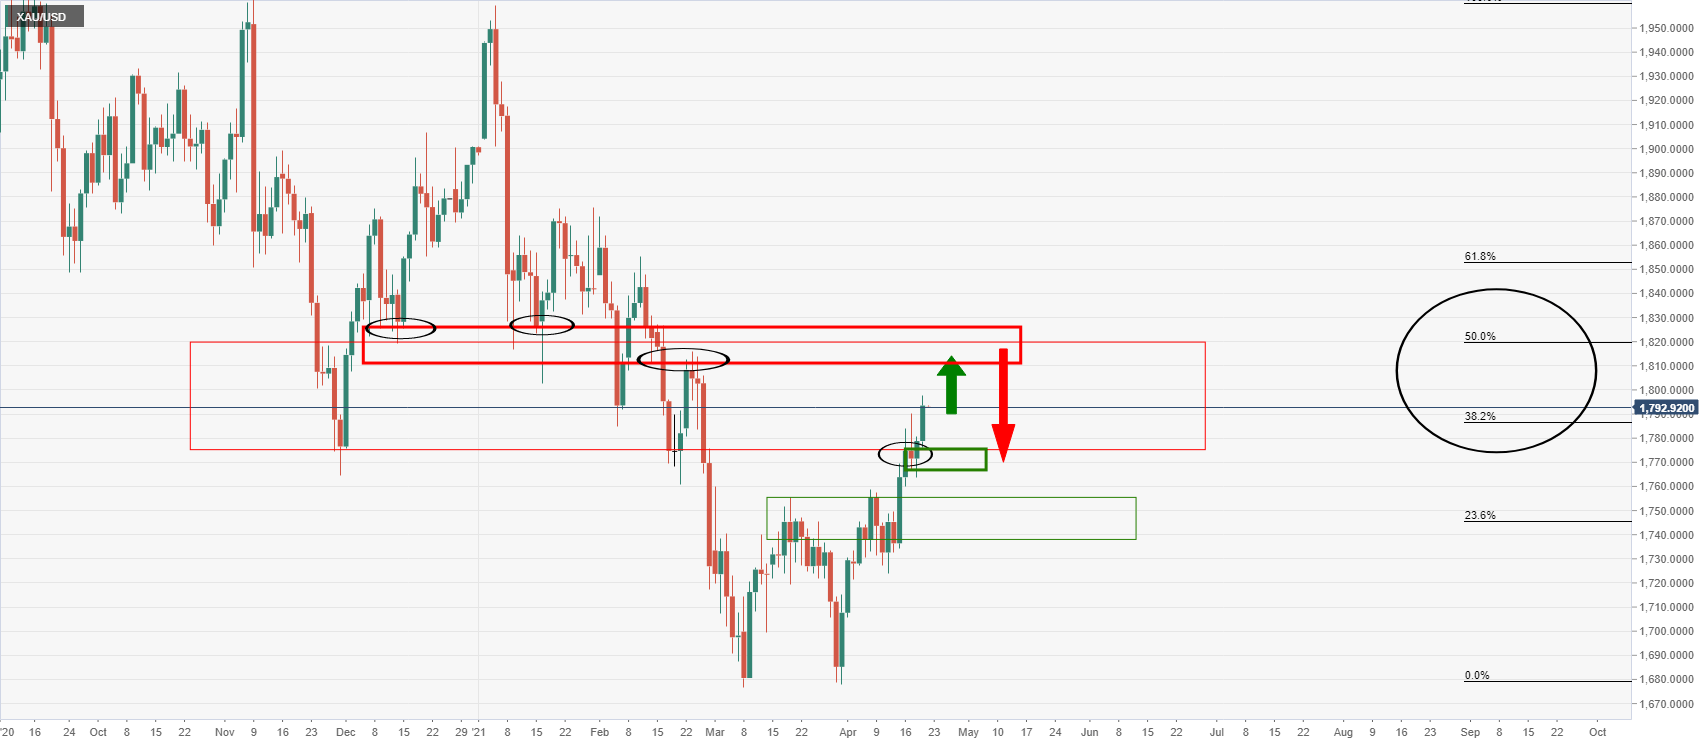
However, there is a daily support structure that may thwart the weekly bearish outlook.
Given the support, then there is a focus on the upside for the meanwhile to target prior structures.
A 50% mean reversion is in focus which has a confluence with the prior structures looking left.
1-hour chart
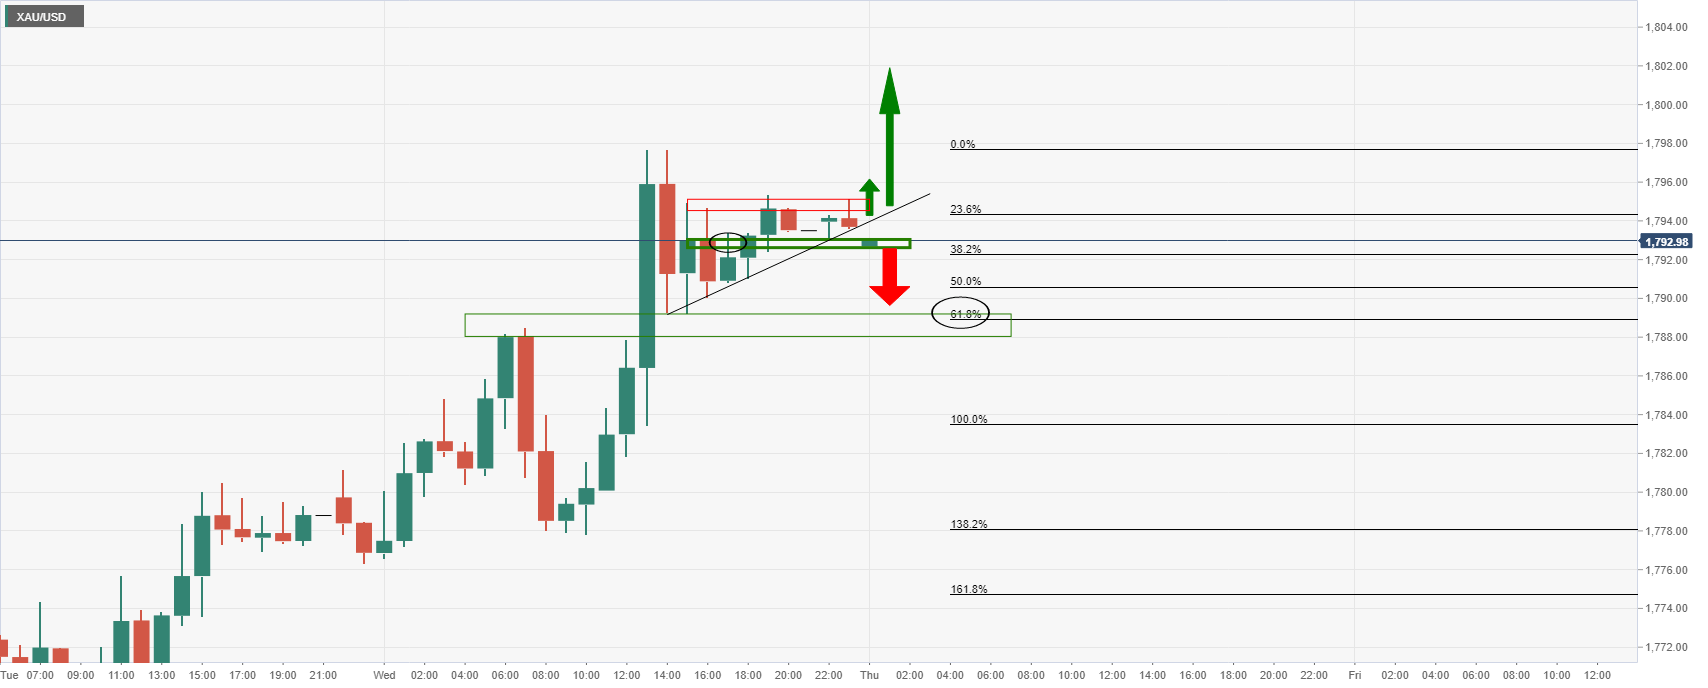
The 1-hour chart shows the price breaking the trendline and testing support.
A break of support opens downside risks to the prior structure.
15-chart
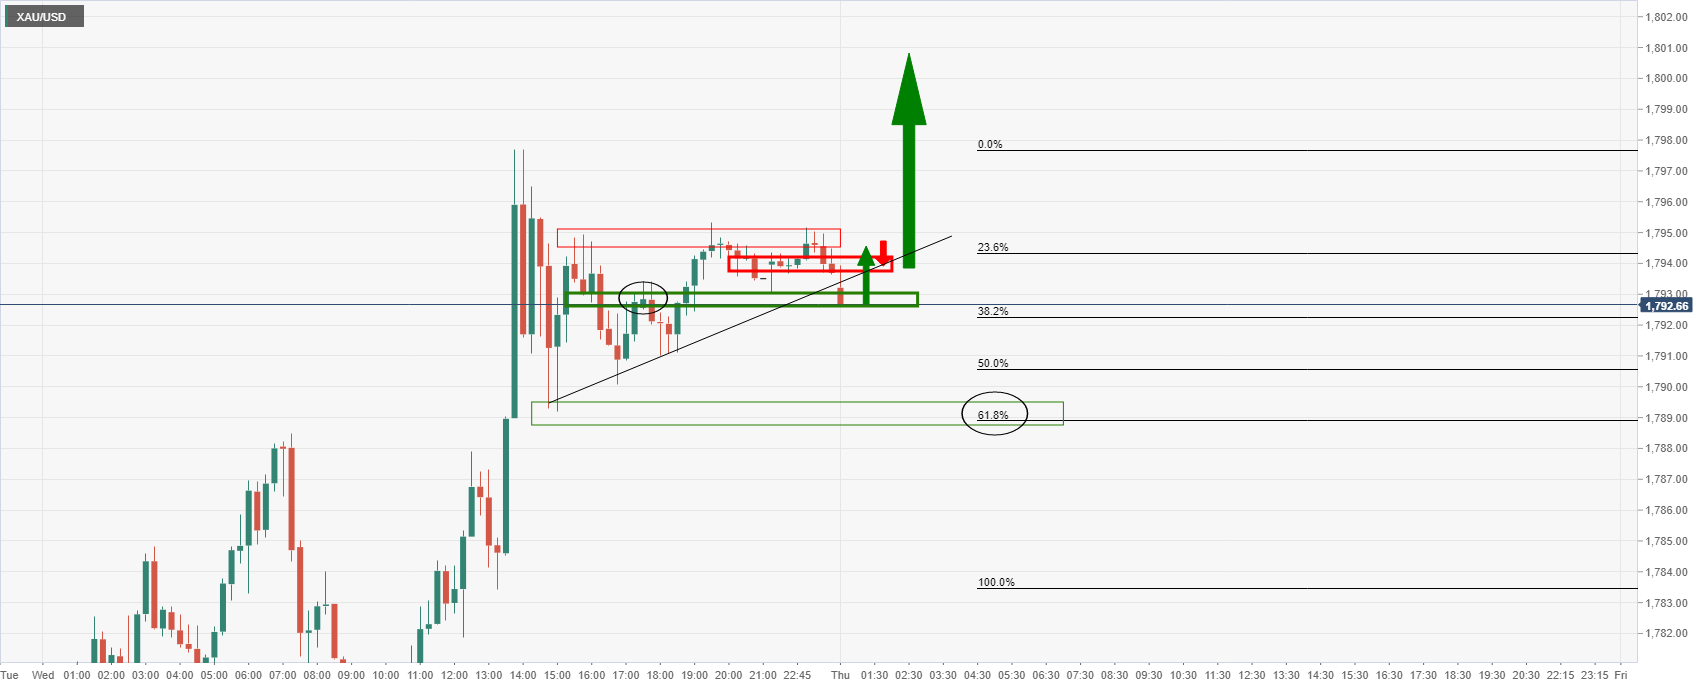
The 15-min chart shows prospects of a break of resistance that could trigger an upside extension.
Author

Ross J Burland
FXStreet
Ross J Burland, born in England, UK, is a sportsman at heart. He played Rugby and Judo for his county, Kent and the South East of England Rugby team.


