|

Gold Price Analysis: Battle lines well-defined as XAU/USD awaits key US data – Confluence Detector

Gold (XAU/USD) is holding onto the overnight recovery gains, underpinned by dovish Fed Chair Powell and President-elect Biden’s $1.9 trillion stimulus plan. The sell-off in the US Treasury yields amid Fed’s dovish monetary policy prospects seems to bode well for the non-yielding gold.

Also, broad-based US dollar weakness amid weak jobs data collaborates with the pullback in the metal. Despite gold’s bounce, investors remain cautious heading into critical US Retail Sales and Michigan Consumer Sentiment releases.

How is gold positioned on the charts?

Gold Price Chart: Key resistances and supports

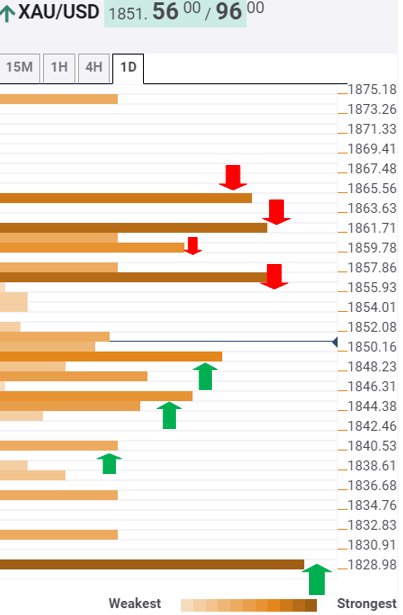
The Technical Confluences Indicator shows that gold has powerful resistance to clear at $1857 (Fibonacci 38.2% one-month) if it wants to take on the upside.

However, its not going to be an easy task for the bulls, as a cluster of resistance levels around $1860/61 would challenge their commitment. That area is the confluence of the Fibonacci 23.6% one-week and pivot point one-day R1.

Further north, the convergence of the SMA50 one-day, SMA200 four-hour and Bollinger Band four-hour Upper at $1864 is the level to beat for the bulls.

To the downside, an immediate cap is seen at $1849, which is the intersection of the SMA5 one-day, SMA100 one-hour and previous high four-hour.

The next significant cushion awaits at $1845, the SMA5 four-hour. A break below the latter could expose the Fibonacci 38.2% one-day at $1840.

The bears will need to crack a couple of minor supports before testing the fierce line of defense at $1829, where the previous week low meets the previous day low.

Here is how it looks on the tool

fxsoriginal

About Confluence Detector

The TCI (Technical Confluences Indicator) is a tool to locate and point out those price levels where there is a congestion of indicators, moving averages, Fibonacci levels, Pivot Points, etc. Knowing where these congestion points are located is very useful for the trader, and can be used as a basis for different strategies.

Learn more about Technical   Confluence

Author

Dhwani Mehta

Dhwani Mehta

FXStreet

Residing in Mumbai (India), Dhwani is a Senior Analyst and Manager of the Asian session at FXStreet. She has over 10 years of experience in analyzing and covering the global financial markets, with specialization in Forex and commodities markets.

More from Dhwani Mehta
Share:

Markets move fast. We move first.

Orange Juice Newsletter brings you expert driven insights - not headlines. Every day on your inbox.

By subscribing you agree to our Terms and conditions.

Editor's Picks

EUR/USD softens below 1.1750 amid ECB rate hold expectations

The EUR/USD pair declines to around 1.1730 during the early European session on Wednesday, pressured by renewed US Dollar demand. Nonetheless, the potential downside for the major pair might be limited amid the growing acceptance that the European Central Bank is done cutting interest rates. 

When is the UK CPI inflation data and how could it affect GBP/USD?

The United Kingdom Office for National Statistics will publish the highly relevant Consumer Price Index (CPI) data for November on Wednesday at 07:00 GMT. GBP/USD is likely to stay subdued if UK CPI meets expectations. However, any upside surprise could cap losses by tempering dovish sentiment ahead of the Bank of England’s policy decision on Thursday. 

Gold: Bulls await breakout through multi-day-old range amid Fed rate cut bets

Gold attracts fresh buyers during the Asian session on Wednesday, though it remains confined in a multi-day-old trading range amid mixed fundamental cues. The global risk sentiment remains on the defensive amid economic woes and fears of the AI bubble burst. Moreover, dovish US Federal Reserve expectations lend support to the non-yielding yellow metal, though a modest US Dollar uptick might cap any further appreciating move.

Bitcoin, Ethereum and Ripple extend correction as bearish momentum builds

Bitcoin, Ethereum, and Ripple remain under pressure as the broader market continues its corrective phase into midweek. The weak price action of these top three cryptocurrencies by market capitalization suggests a deeper correction, as momentum indicators are beginning to tilt bearish.

Ukraine-Russia in the spotlight once again

Since the start of the week, gold’s price has moved lower, but has yet to erase the gains made last week. In today’s report we intend to focus on the newest round of peace talks between Russia and Ukraine, whilst noting the release of the US Employment data later on day and end our report with an update in regards to the tensions brewing in Venezuela.

BNB Price Forecast: BNB slips below $855 as bearish on-chain signals and momentum indicators turn negative

BNB, formerly known as Binance Coin, continues to trade down around $855 at the time of writing on Tuesday, after a slight decline the previous day. Bearish sentiment further strengthens as BNB’s on-chain and derivatives data show rising retail activity.