Gold (XAU/USD) consolidates Wednesday’s 1.30% rally in the lead up to the much-awaited Fed Chair Jerome Powell’s speech at the Jackson Hole Symposium on Thursday. The US dollar drops with Treasury yields amid dovish Fed expectations, with markets expecting Powell to hint at a new policy framework to resolve its persistent fight with low inflation.
Meanwhile, the renewed US-Sino tensions over the South China Sea dispute combined with growing fears of the second-wave of coronavirus underpins the safe-haven appeal of gold. Ahead of Powell’s speech, traders will await fresh cues from the US Q2 Preliminary GDP release. Let’s look at the key technical levels for trading gold in the day ahead.
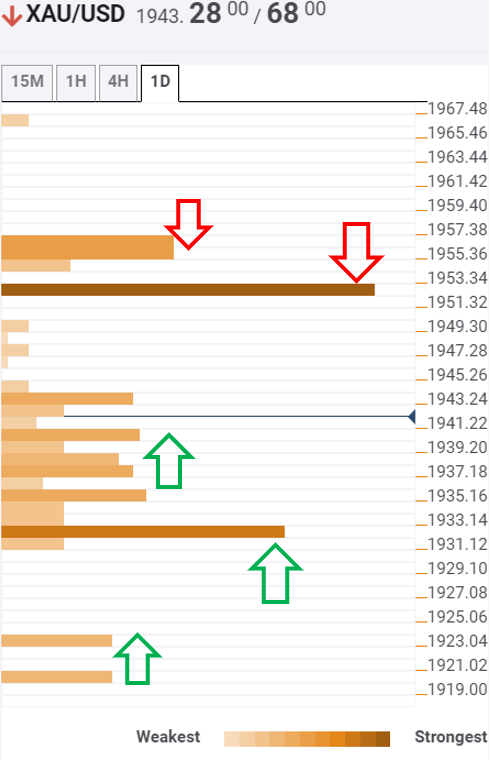
Gold: Key resistances and supports
The tool shows that gold wavers in a tight range, with a cluster of minor support levels stacked up between $1940-35, keeping the retracement in check. The demand zone is the confluence of the Fibonacci 23.6% one-week, Fibonacci 38.2% one-day and SMA5 one-day.
A breach of that area could see a test of the critical support at $1932, where the Fibonacci 23.6% one-month and SMA50 one-hour coincide.
The next downside support awaits at $1923, the Fibonacci 61.8% one-day. The pivot point one-day S1 at $1920 is another cushion to the downside.
Meanwhile, the bulls need a decisive break above the fierce $1952 barrier, the intersection of the Fibonacci 38.2% one-week, SMA10 one-day and SMA50 four-hour, to revive the recent bullish momentum.
The next hurdle is seen at $1956, the convergence of the previous high and Bollinger Band four-hour Upper.
Here is how it looks on the tool
About the Confluence Detector
The TCI (Technical Confluences Indicator) is a tool to locate and point out those price levels where there is a congestion of indicators, moving averages, Fibonacci levels, Pivot Points, etc. Knowing where these congestion points are located is very useful for the trader, and can be used as a basis for different strategies.
Information on these pages contains forward-looking statements that involve risks and uncertainties. Markets and instruments profiled on this page are for informational purposes only and should not in any way come across as a recommendation to buy or sell in these assets. You should do your own thorough research before making any investment decisions. FXStreet does not in any way guarantee that this information is free from mistakes, errors, or material misstatements. It also does not guarantee that this information is of a timely nature. Investing in Open Markets involves a great deal of risk, including the loss of all or a portion of your investment, as well as emotional distress. All risks, losses and costs associated with investing, including total loss of principal, are your responsibility. The views and opinions expressed in this article are those of the authors and do not necessarily reflect the official policy or position of FXStreet nor its advertisers. The author will not be held responsible for information that is found at the end of links posted on this page.
If not otherwise explicitly mentioned in the body of the article, at the time of writing, the author has no position in any stock mentioned in this article and no business relationship with any company mentioned. The author has not received compensation for writing this article, other than from FXStreet.
FXStreet and the author do not provide personalized recommendations. The author makes no representations as to the accuracy, completeness, or suitability of this information. FXStreet and the author will not be liable for any errors, omissions or any losses, injuries or damages arising from this information and its display or use. Errors and omissions excepted.
The author and FXStreet are not registered investment advisors and nothing in this article is intended to be investment advice.
Recommended content
Editors’ Picks
EUR/USD edges lower toward 1.0700 post-US PCE

EUR/USD stays under modest bearish pressure but manages to hold above 1.0700 in the American session on Friday. The US Dollar (USD) gathers strength against its rivals after the stronger-than-forecast PCE inflation data, not allowing the pair to gain traction.
GBP/USD retreats to 1.2500 on renewed USD strength

GBP/USD lost its traction and turned negative on the day near 1.2500. Following the stronger-than-expected PCE inflation readings from the US, the USD stays resilient and makes it difficult for the pair to gather recovery momentum.
Gold struggles to hold above $2,350 following US inflation

Gold turned south and declined toward $2,340, erasing a large portion of its daily gains, as the USD benefited from PCE inflation data. The benchmark 10-year US yield, however, stays in negative territory and helps XAU/USD limit its losses.
Bitcoin Weekly Forecast: BTC’s next breakout could propel it to $80,000 Premium

Bitcoin’s recent price consolidation could be nearing its end as technical indicators and on-chain metrics suggest a potential upward breakout. However, this move would not be straightforward and could punish impatient investors.
Week ahead – Hawkish risk as Fed and NFP on tap, Eurozone data eyed too

Fed meets on Wednesday as US inflation stays elevated. Will Friday’s jobs report bring relief or more angst for the markets? Eurozone flash GDP and CPI numbers in focus for the Euro.