Gold Price Analysis: $1952 back in sight for XAU/USD bulls – Confluence Detector

Gold (XAU/USD) is on a steady rise on Friday, recovering ground after Fed Chair Powell’s adoption of the average inflation targeting strategy. The yellow metal benefits from broad-based US dollar weakness, as global markets cheer Fed’s lower rates for a longer period and down greenback’s haven demand.
The bounce, however, could remain elusive amid a rally in the US Treasury yields, as the inflation expectations hit a seven-year high. How is gold positioned technically?
Gold: Key resistances and supports
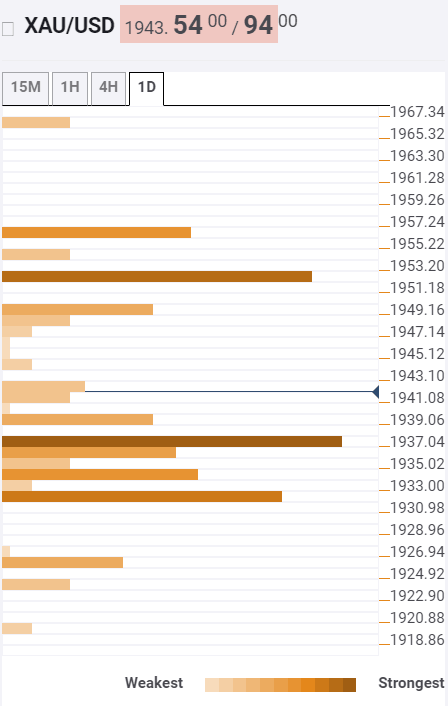
The tool shows that gold has regained the critical resistance now support at $1937, the convergence of the Fibonacci 23.6% one-week and SMA5 one-day.
The next relevance barrier to the upside is seen at $1949, the intersection of the SMA200 on one-hour and SMA10 one-day.
Further north, the robust resistance at $1952 will come into play once again. That level is the confluence of the Fibonacci 61.8% one-day and Fibonacci 38.2% one-week.
Also, the buyers aim for $1957, which is the next hurdle.
Alternatively, below the aforementioned $1937 support, the $1932 cushion (Fibonacci 23.6% one-month) will slow down the declines.
The next downside target awaits at $1924, the Fibonacci 23.6% one-day.
Here is how it looks on the tool
About the Confluence Detector
The TCI (Technical Confluences Indicator) is a tool to locate and point out those price levels where there is a congestion of indicators, moving averages, Fibonacci levels, Pivot Points, etc. Knowing where these congestion points are located is very useful for the trader, and can be used as a basis for different strategies.
Author

Dhwani Mehta
FXStreet
Residing in Mumbai (India), Dhwani is a Senior Analyst and Manager of the Asian session at FXStreet. She has over 10 years of experience in analyzing and covering the global financial markets, with specialization in Forex and commodities markets.


