Gold Price Analysis: $1874 remains a tough nut to crack for XAU/USD ahead of FOMC minutes – Confluence Detector
- Gold price falls after facing strong resistance once again at $1874.
- US dollar rebound with yields, risk-aversion dominates ahead of FOMC minutes.
- Gold price to lose some of its lustre as real yields rebound – CE

Gold price is on a corrective decline ahead of the FOMC minutes showdown, having refreshed three-month highs at $1874 earlier on. The market mood remains sour amid inflation fears and covid flareups in some nations, boosting the safe-haven US dollar. The uptick in the Treasury yields is also weighing on gold price.
Markets eagerly await the release of the FOMC April meeting’s minutes for fresh hints on the central bank’s monetary policy path, which is likely to have a significant impact on gold price.
Read: April FOMC Minutes Preview: Can there be one monetary policy for inflation and jobs?
Gold Price: Key levels to watch
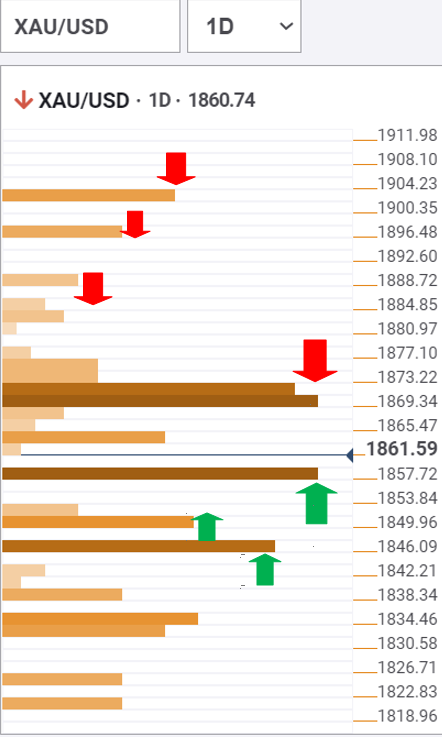
The Technical Confluences Detector shows that gold price has failed to chew strong offers once again around the $1870-$1874 zone, which is the confluence of the Fibonacci 61.8% one-day, SMA10 four-hour and Bollinger Band one-day Upper.
If the abovementioned dense cluster of resistance levels are taken, then gold bulls could target the next upside barrier in the vicinity of $1885.
The pivot point one-day R3 coincides with the Bollinger Band four-hour Upper around that level.
The next bullish target is envisioned at the pivot point one-week R3 of $1896, above which the $1901 – pivot point one-month R2 could be probed.
However, the downside could extend if gold price fails to defend the immediate powerful support at $1858, where the Fibonacci 161.8% one-day, pivot point one-day S2 and pivot point one-week R1 converge.
The floors will subsequently open up for a test of the SMA100 one-hour at $1850.
Acceptance under the $1846 cap is critical for the bears to extend control. The latter is the intersection of the SMA200 one-day and the previous week high.
Here is how it looks on the tool
About Technical Confluences Detector
The TCD (Technical Confluences Detector) is a tool to locate and point out those price levels where there is a congestion of indicators, moving averages, Fibonacci levels, Pivot Points, etc. If you are a short-term trader, you will find entry points for counter-trend strategies and hunt a few points at a time. If you are a medium-to-long-term trader, this tool will allow you to know in advance the price levels where a medium-to-long-term trend may stop and rest, where to unwind positions, or where to increase your position size.
Author

Dhwani Mehta
FXStreet
Residing in Mumbai (India), Dhwani is a Senior Analyst and Manager of the Asian session at FXStreet. She has over 10 years of experience in analyzing and covering the global financial markets, with specialization in Forex and commodities markets.
















