|
Gold New York Price Forecast: XAU/USD recovers from 2020 lows as Fed announces 'Q-Infinity'
- XAU/USD bounces off 2020 lows as Fed announces unlimited bond-buying scheme.
- Resistance is seen in the 1530/40 price zone.

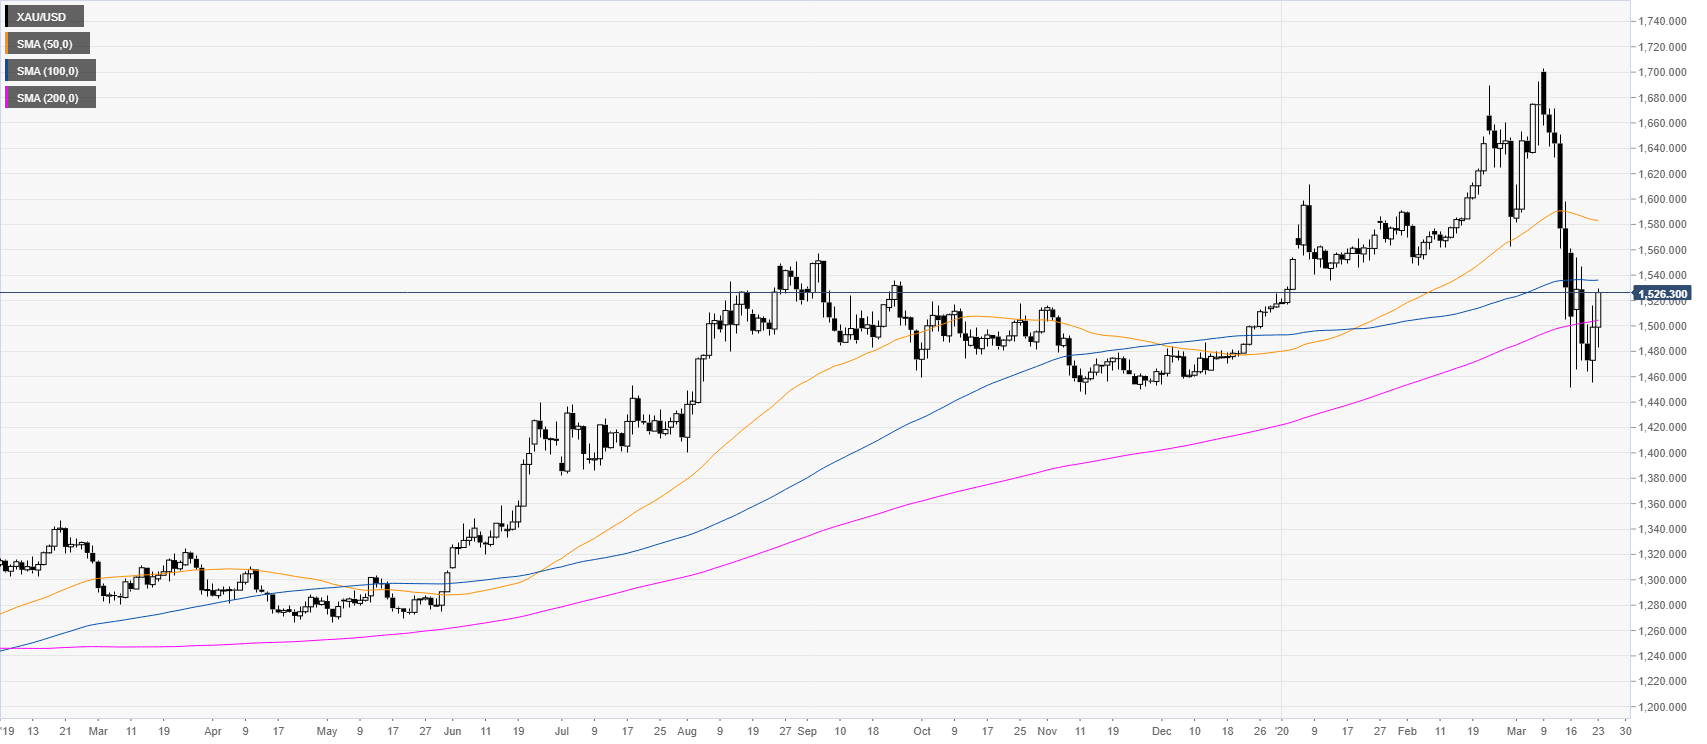
XAU/USD daily chart
After suffering a steep decline, gold is reacting up near the 200 SMA (simple moving average) on the daily chart, while still trading below the 50 and 100 SMAs. XAU/USD is consolidating losses and gaining some steam above $1500 per troy ounce as the Fed announces unlimited Quantitative Easing (QE).
XAU/USD four-hour chart
The metal is bouncing off the 2020 lows as the bulls are challenging the 1530/40 resistance level and the 50 SMA on the four-hour chart. A break above the mentioned level can lead to further gains toward the 1565 resistance line. Support can be expected near the 1500 and 1480 price levels.

Resistance: 1530, 1540, 1565
Support: 1500, 1480, 1460
Additional key levels
Author

Flavio Tosti
Independent Analyst
More from Flavio Tosti


