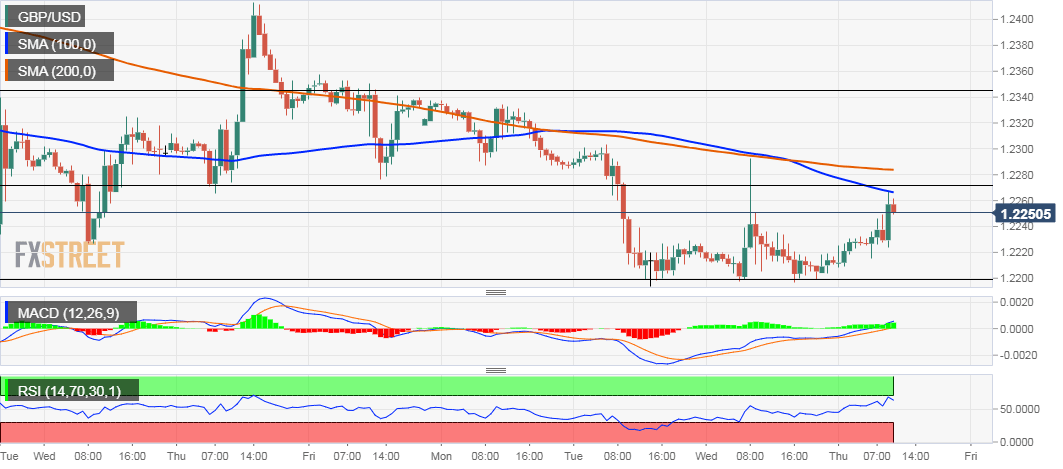
- The pair continues to show some resilience near 61.8% Fibo. level.
- Bulls await a sustained move beyond the overnight swing high.
The GBP/USD pair once again showed some resilience below the 1.2200 round-figure mark on Thursday and witnessed a solid rebound from support marked by 61.8% Fibonacci level of the 1.1958-1.2583 recent strong move up. The intraday buying interest picked up some pace in the last hour and lifted the pair to fresh session tops, levels beyond mid-1.2200s.
The mentioned region coincides with 50% Fibo. level and is closely followed by 200-hour SMA near the 1.2285 region – overnight swing high. A sustained move beyond the mentioned barriers might be seen as a key trigger for bullish traders and set the stage for a further intraday appreciating move towards 38.2% Fibo. level resistance – around the 1.2345 region.
Meanwhile, technical indicators on the 1-hourly chart have been scaling higher and also recovered from the negative territory on the 4-hourly chart, reinforcing the intraday bullish bias. However, oscillators on the daily chart maintained their bearish bias and warrant some caution before placing any aggressive bullish bets amid persistent Brexit-related uncertainties.
Alternatively, rejection slide from the current resistance area, leading to a subsequent slide below the 1.2235 horizontal zone might now accelerate the slide back towards the 1.2200 handle. Failure to defend the mentioned 61.8% Fibo. level support might inspire bears to drag the pair further towards the 1.2160 intermediate support ahead of the 1.2110-1.2100 region.
GBP/USD 1-hourly chart
Information on these pages contains forward-looking statements that involve risks and uncertainties. Markets and instruments profiled on this page are for informational purposes only and should not in any way come across as a recommendation to buy or sell in these assets. You should do your own thorough research before making any investment decisions. FXStreet does not in any way guarantee that this information is free from mistakes, errors, or material misstatements. It also does not guarantee that this information is of a timely nature. Investing in Open Markets involves a great deal of risk, including the loss of all or a portion of your investment, as well as emotional distress. All risks, losses and costs associated with investing, including total loss of principal, are your responsibility. The views and opinions expressed in this article are those of the authors and do not necessarily reflect the official policy or position of FXStreet nor its advertisers. The author will not be held responsible for information that is found at the end of links posted on this page.
If not otherwise explicitly mentioned in the body of the article, at the time of writing, the author has no position in any stock mentioned in this article and no business relationship with any company mentioned. The author has not received compensation for writing this article, other than from FXStreet.
FXStreet and the author do not provide personalized recommendations. The author makes no representations as to the accuracy, completeness, or suitability of this information. FXStreet and the author will not be liable for any errors, omissions or any losses, injuries or damages arising from this information and its display or use. Errors and omissions excepted.
The author and FXStreet are not registered investment advisors and nothing in this article is intended to be investment advice.
Recommended content
Editors’ Picks
EUR/USD holds below 1.0750 ahead of key US data

EUR/USD trades in a tight range below 1.0750 in the European session on Friday. The US Dollar struggles to gather strength ahead of key PCE Price Index data, the Fed's preferred gauge of inflation, and helps the pair hold its ground.
GBP/USD consolidates above 1.2500, eyes on US PCE data

GBP/USD fluctuates at around 1.2500 in the European session on Friday following the three-day rebound. The PCE inflation data for March will be watched closely by market participants later in the day.
Gold clings to modest daily gains at around $2,350

Gold stays in positive territory at around $2,350 after closing in positive territory on Thursday. The benchmark 10-year US Treasury bond yield edges lower ahead of US PCE Price Index data, allowing XAU/USD to stretch higher.
Bitcoin Weekly Forecast: BTC’s next breakout could propel it to $80,000 Premium

Bitcoin’s recent price consolidation could be nearing its end as technical indicators and on-chain metrics suggest a potential upward breakout. However, this move would not be straightforward and could punish impatient investors.
US core PCE inflation set to signal firm price pressures as markets delay Federal Reserve rate cut bets

The core PCE Price Index, which excludes volatile food and energy prices, is seen as the more influential measure of inflation in terms of Fed positioning. The index is forecast to rise 0.3% on a monthly basis in March, matching February’s increase.