GBP/USD technical analysis: Clings to 23.6% Fibo, bears target 1.2700 during further declines
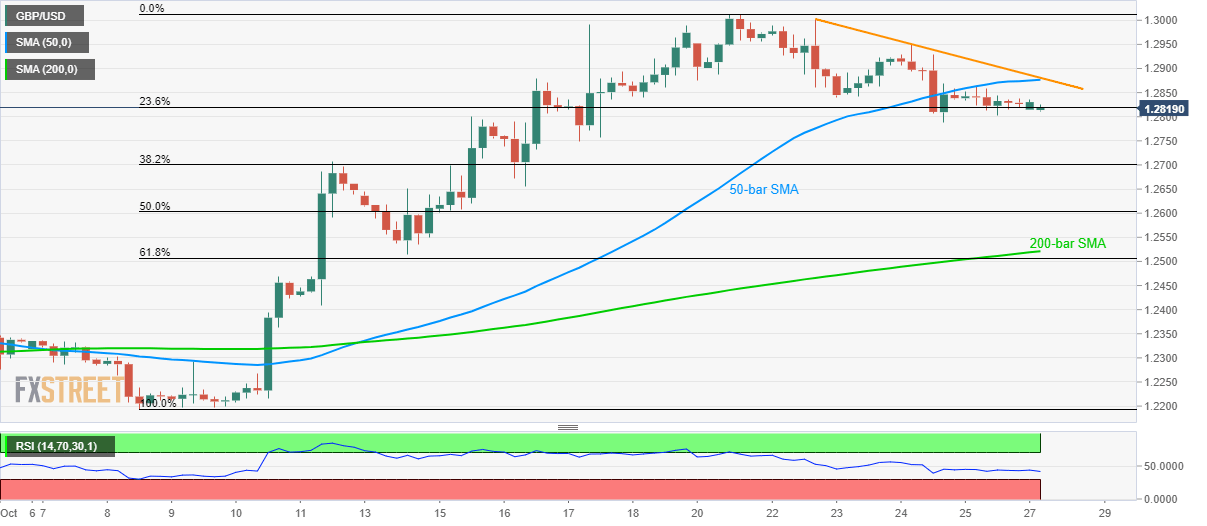
- GBP/USD trades below 50-bar SMA, one-week-old falling trend line.
- 38.2% Fibonacci retracement and 200-bar SMA next on sellers’ radar.
Although 23.6% Fibonacci retracement of the recent run-up holds tightly to the GBP/USD pair, failure to rise past 50-day SMA and a short-term descending resistance keep sellers hopeful. The quote takes the rounds to 1.2820 while heading into the London open on Monday.
Sellers may now aim for 38.2% Fibonacci retracement level of the pair’s rise since October 10, near 1.2700 while 200-bar Simple Moving Average (SMA) could restrict further downside near 1.2520.
In a case where bears dominate past-1.2520, 61.8% Fibonacci retracement could give the last chance to buyers for sneaking in around 1.2500, if not then 1.2350 could flash on the chart.
On the contrary, the pair’s ability to rise beyond 1.2875/80 resistance confluence could propel prices to 1.2960 and then towards 1.3000 round-figure.
However, buyers need to keep a hold above the recent high of 1.3015 to aim for May month tops close to 1.3180.
GBP/USD 4-hour chart
Trend: pullback expected
Author

Anil Panchal
FXStreet
Anil Panchal has nearly 15 years of experience in tracking financial markets. With a keen interest in macroeconomics, Anil aptly tracks global news/updates and stays well-informed about the global financial moves and their implications.


