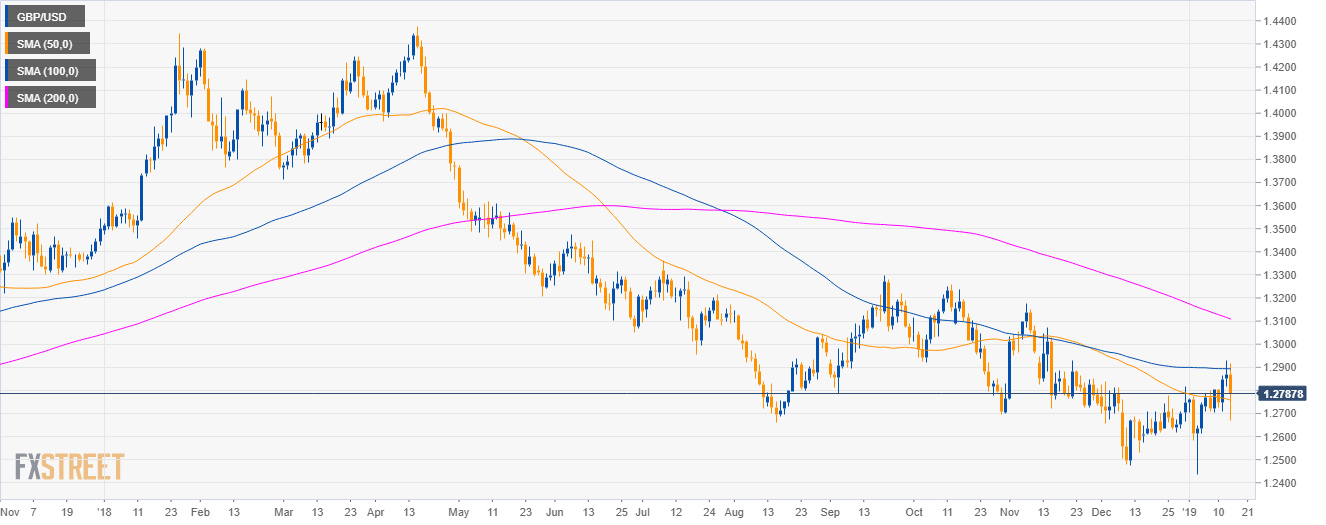
GBP/USD daily chart
- GBP/USD is trading in a bear trend below the 100 and 200 simple moving averages (SMAs).
- Parliament voted down PM May's Brexit deal.
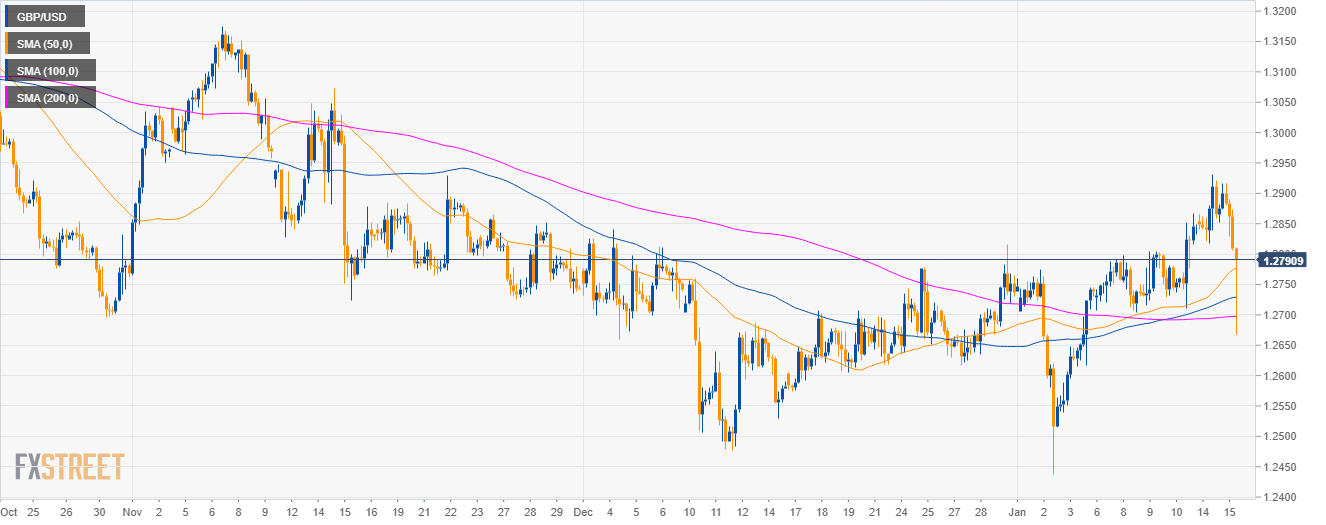
GBP/USD 4-hour chart
- GBP/USD is trading above its main SMAs.
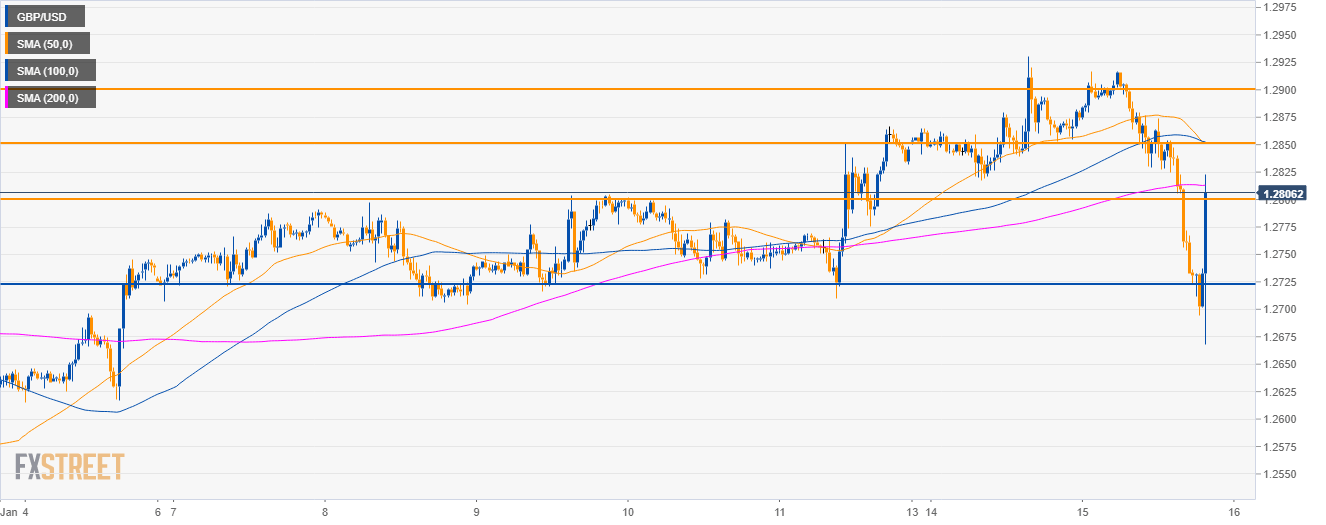
GBP/USD 30-minute chart
- GBP Bulls are back and the next target is likely the 1.2850 level.
Additional key levels
GBP/USD
Overview:
Today Last Price: 1.2775
Today Daily change: -93 pips
Today Daily change %: -0.723%
Today Daily Open: 1.2868
Trends:
Previous Daily SMA20: 1.2708
Previous Daily SMA50: 1.2763
Previous Daily SMA100: 1.2893
Previous Daily SMA200: 1.3118
Levels:
Previous Daily High: 1.2931
Previous Daily Low: 1.2818
Previous Weekly High: 1.2866
Previous Weekly Low: 1.2704
Previous Monthly High: 1.284
Previous Monthly Low: 1.2477
Previous Daily Fibonacci 38.2%: 1.2888
Previous Daily Fibonacci 61.8%: 1.2861
Previous Daily Pivot Point S1: 1.2813
Previous Daily Pivot Point S2: 1.2759
Previous Daily Pivot Point S3: 1.27
Previous Daily Pivot Point R1: 1.2926
Previous Daily Pivot Point R2: 1.2985
Previous Daily Pivot Point R3: 1.304
Note: All information on this page is subject to change. The use of this website constitutes acceptance of our user agreement. Please read our privacy policy and legal disclaimer. Opinions expressed at FXstreet.com are those of the individual authors and do not necessarily represent the opinion of FXstreet.com or its management. Risk Disclosure: Trading foreign exchange on margin carries a high level of risk, and may not be suitable for all investors. The high degree of leverage can work against you as well as for you. Before deciding to invest in foreign exchange you should carefully consider your investment objectives, level of experience, and risk appetite. The possibility exists that you could sustain a loss of some or all of your initial investment and therefore you should not invest money that you cannot afford to lose. You should be aware of all the risks associated with foreign exchange trading, and seek advice from an independent financial advisor if you have any doubts.
Recommended content
Editors’ Picks
EUR/USD holds above 1.0700 ahead of key US data

EUR/USD trades in a tight range above 1.0700 in the early European session on Friday. The US Dollar struggles to gather strength ahead of key PCE Price Index data, the Fed's preferred gauge of inflation, and helps the pair hold its ground.
USD/JPY stays above 156.00 after BoJ Governor Ueda's comments

USD/JPY holds above 156.00 after surging above this level with the initial reaction to the Bank of Japan's decision to leave the policy settings unchanged. BoJ Governor said weak Yen was not impacting prices but added that they will watch FX developments closely.
Gold price oscillates in a range as the focus remains glued to the US PCE Price Index

Gold price struggles to attract any meaningful buyers amid the emergence of fresh USD buying. Bets that the Fed will keep rates higher for longer amid sticky inflation help revive the USD demand.
Sei Price Prediction: SEI is in the zone of interest after a 10% leap

Sei price has been in recovery mode for almost ten days now, following a fall of almost 65% beginning in mid-March. While the SEI bulls continue to show strength, the uptrend could prove premature as massive bearish sentiment hovers above the altcoin’s price.
US core PCE inflation set to signal firm price pressures as markets delay Federal Reserve rate cut bets

The core PCE Price Index, which excludes volatile food and energy prices, is seen as the more influential measure of inflation in terms of Fed positioning. The index is forecast to rise 0.3% on a monthly basis in March, matching February’s increase.