GBP/USD technical analysis: Bears eye 2-year low as MACD indicates further selling
- GBP/USD drops below 1.2000 after breaking August month low.
- 2017 and 2016 lows are in the spotlight for now.
With its sustained trading below three-week-old rising trend-line, the GBP/USD pair declines to 1.1996, before recovering to 1.2015, ahead of Tuesday’s market opening at the UK.
Considering likely reversal of 12-bar moving average convergence and divergence (MACD) indicator towards bearish region, the pair is more likely to extend its south-run below 1.2000 round-figure towards the year 2017 low near 1.1987 during further declines.
In case prices keep falling past-1.1987, late-2016 bottom surrounding 1.1800 will flash on the chart.
Alternatively, 1.2100 offers immediate resistance to the pair ahead of pushing it to confront support-turned-resistance around 1.2150. During the pair’s additional rise past-1.2150, 10-day simple moving average (DMA) near 1.2180 and a four-month-old falling trend-line, at 1.2250, will be in the spotlight.
GBP/USD daily chart
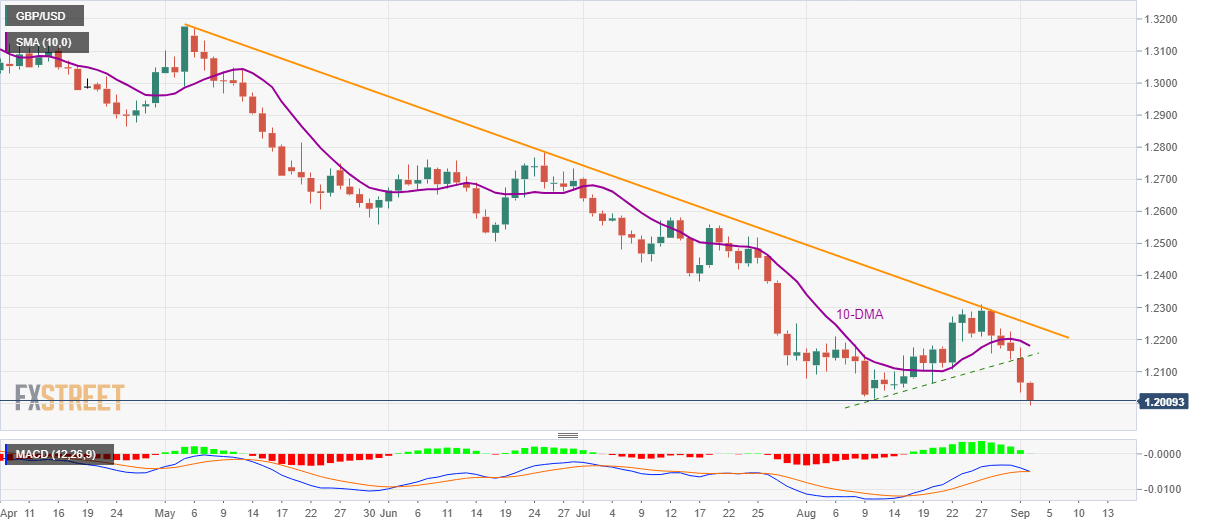
Trend: bearish
Author

Anil Panchal
FXStreet
Anil Panchal has nearly 15 years of experience in tracking financial markets. With a keen interest in macroeconomics, Anil aptly tracks global news/updates and stays well-informed about the global financial moves and their implications.


