|

GBP/USD spreads ahead of the 2023 closing bell

  • GBP/USD churns chart paper near 1.2740.
  • UK annualized Nationwide Housing Prices slip, US Chicago PMI also misses.
  • Soft data not shaking out Fed rate cut bets.

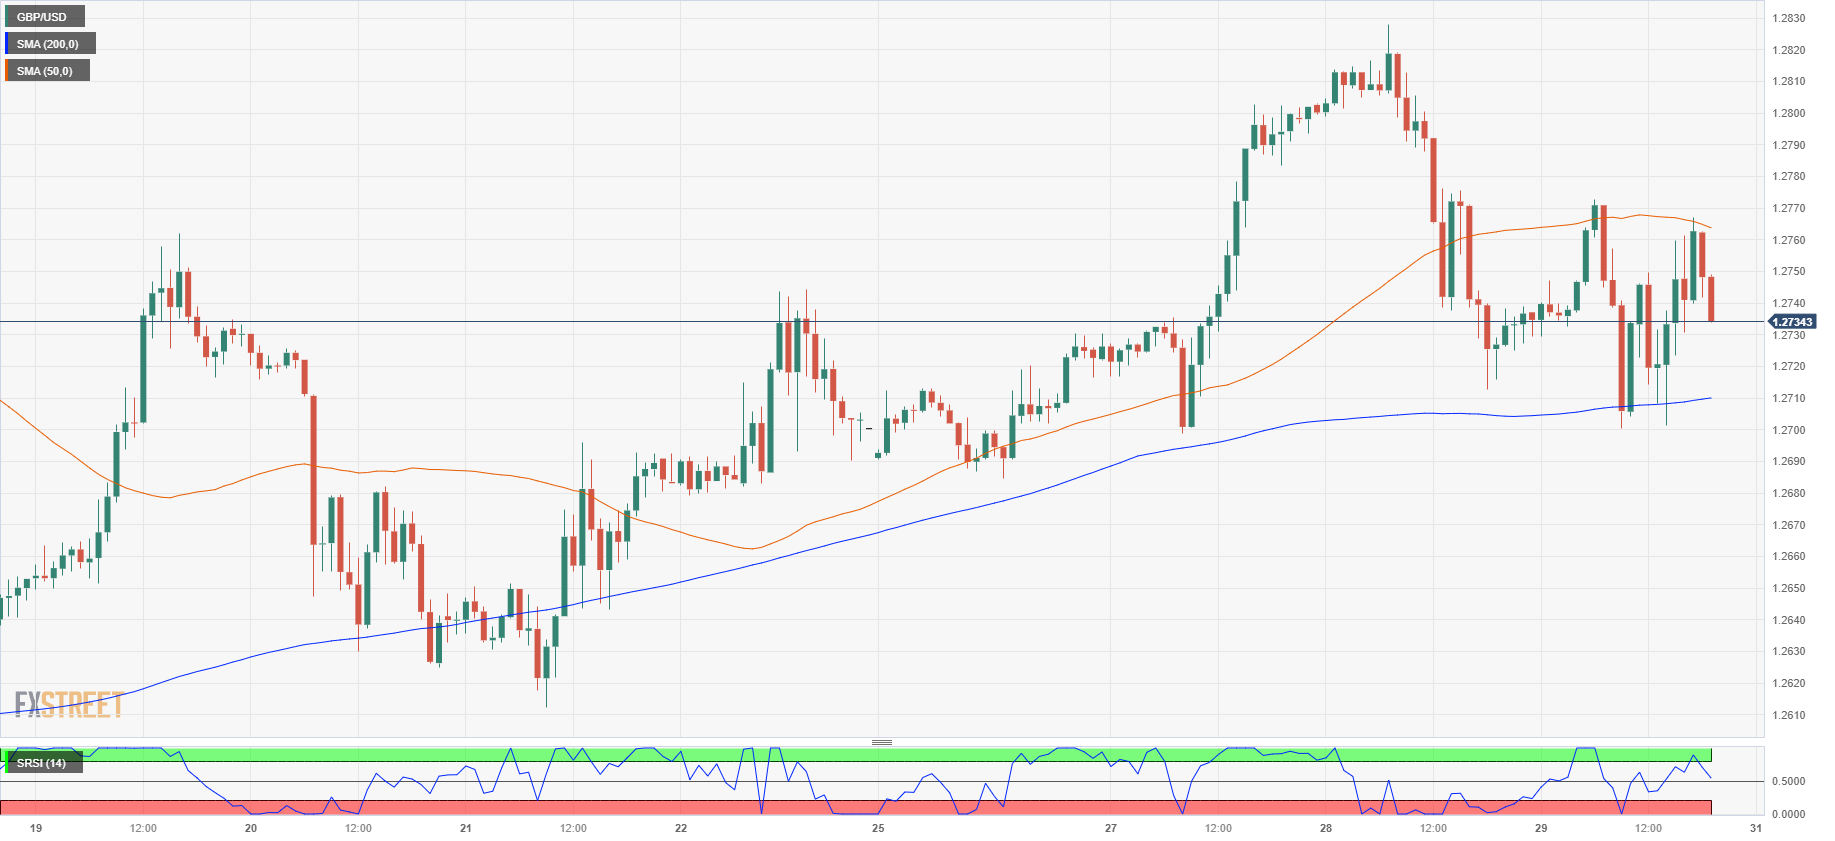
The GBP/USD is cycling in near-term congestion as thin post-holiday markets get set to wrap up the last day of trading in 2023, testing back into intraday median prices just above the 1.2700 handle.

The UK’s Nationwide Housing Prices slipped back further than expected in the annualized figure, printing at -1.8% for the year ending December versus the forecast -1.4%. Markets were expecting a healthier rebound from the previous period’s -2.0% print. Declining UK economic figures are capping off the Pound Sterling (GBP), which is largely catching support from a broad-market sell-off in the US Dollar (USD) as markets bet on faster and deeper rate cuts from the Federal Reserve (Fed) in 2024.

The US Chicago Purchasing Managers’ Index (PMI) declined faster than expected for December, printing at a contractionary 46.9, dropping through the market forecast of 51.0 and pulling further back from November’s 18-month high of 55.8. A worsening US economic outlook is counter-intuitively sparking risk appetite across broader markets, as investors look for anything to push the Fed into accelerating the uptake on the next rate-cutting cycle, currently expected to begin early next year, with the first rate slash broadly expected to occur in March or April.

GBP/USD Technical Outlook

With markets gearing up for the rollover into the 2024 trading year, the GBP/USD is testing into a near-ter midrange as the pair gets squeezed between the 50-hour and 200-hour Simple Moving Averages (SMA) between 1.2760 and the 1.2700 handle.

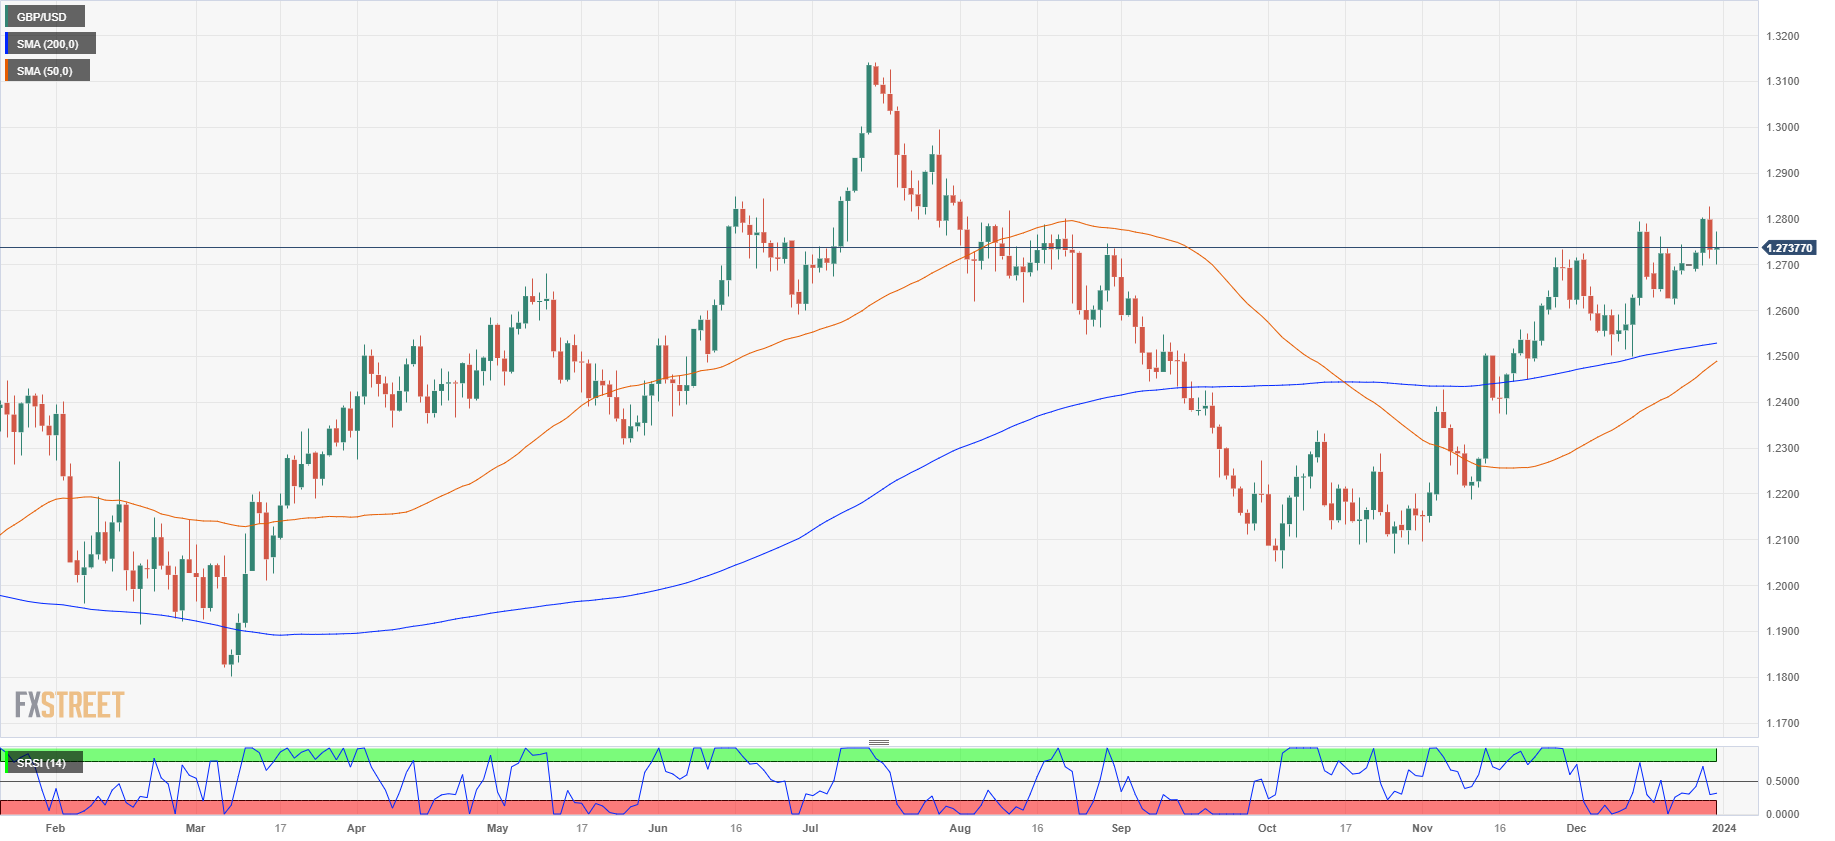
Daily candlesticks have the GBP/USD struggling to develop real momentum beyond the 1.2700 handle, despite a consistent higher-high/higher-low pattern baked into candles. With most of the pair’s upside momentum coming from broad-market USD short pressure, any recovery in the wider Dollar Index is likely to see a sharp drawdown for the Pound Sterling.

GBP/USD Hourly Chart

GBP/USD Daily Chart

GBP/USD Technical Levels

GBP/USD

Overview
Today last price1.2738
Today Daily Change0.0005
Today Daily Change %0.04
Today daily open1.2733
 
Trends
Daily SMA201.2659
Daily SMA501.2478
Daily SMA1001.2449
Daily SMA2001.2527
 
Levels
Previous Daily High1.2828
Previous Daily Low1.2713
Previous Weekly High1.2762
Previous Weekly Low1.2612
Previous Monthly High1.2733
Previous Monthly Low1.2096
Daily Fibonacci 38.2%1.2757
Daily Fibonacci 61.8%1.2784
Daily Pivot Point S11.2688
Daily Pivot Point S21.2643
Daily Pivot Point S31.2572
Daily Pivot Point R11.2803
Daily Pivot Point R21.2873
Daily Pivot Point R31.2918

Author

Joshua Gibson

Joshua joins the FXStreet team as an Economics and Finance double major from Vancouver Island University with twelve years' experience as an independent trader focusing on technical analysis.

More from Joshua Gibson
Share:

Markets move fast. We move first.

Orange Juice Newsletter brings you expert driven insights - not headlines. Every day on your inbox.

By subscribing you agree to our Terms and conditions.

Editor's Picks

EUR/USD drops to daily lows near 1.1630

EUR/USD now loses some traction and slips back to the area of daily lows around 1.1630 on the back of a mild bounce in the US Dollar. Fresh US data, including the September PCE inflation numbers and the latest read on December consumer sentiment, didn’t really move the needle, so the pair is still on course to finish the week with a respectable gain.

GBP/USD trims gains, recedes toward 1.3320

GBP/USD is struggling to keep its daily advance, coming under fresh pressure and retreating to the 1.3320 zone following a mild bullish attempt in the Greenback. Even though US consumer sentiment surprised to the upside, the US Dollar isn’t getting much love, as traders are far more interested in what the Fed will say next week.

Gold makes a U-turn, back to $4,200

Gold is now losing the grip and receding to the key $4,200 region per troy ounce following some signs of life in the Greenback and a marked bounce in US Treasury yields across the board. The positive outlook for the precious metal, however, remains underpinned by steady bets for extra easing by the Fed.

Crypto Today: Bitcoin, Ethereum, XRP pare gains despite increasing hopes of upcoming Fed rate cut

Bitcoin is steadying above $91,000 at the time of writing on Friday. Ethereum remains above $3,100, reflecting positive sentiment ahead of the Federal Reserve's (Fed) monetary policy meeting on December 10.

Week ahead – Rate cut or market shock? The Fed decides

Fed rate cut widely expected; dot plot and overall meeting rhetoric also matter. Risk appetite is supported by Fed rate cut expectations; cryptos show signs of life. RBA, BoC and SNB also meet; chances of surprises are relatively low.

Ripple faces persistent bear risks, shrugging off ETF inflows

Ripple is extending its decline for the second consecutive day, trading at $2.06 at the time of writing on Friday. Sentiment surrounding the cross-border remittance token continues to lag despite steady inflows into XRP spot ETFs.