GBP/USD: Range bound around 1.3800 amid softer USD, Brexit jitters


  • GBP/USD is trading directionless around 1.3800
  • Brexit concerns offset the US dollar’s weakness amid mixed markets.
  • The cable remains trapped between 21 and 200-DMAs, with bearish RSI.

GBP/USD is alternating between gains and losses around the 1.3800 level, looking vulnerable amid looming Brexit concerns.

Although, the GBP bulls continue to fight for control, as the US dollar remains on the defensive amid mixed clues on the Fed’s next policy move.

On the latest update, post-Brexit trade frictions have "significantly altered" freight traffic between Ireland and Britain and sparked a steep rise in volumes to and from Ireland and other European Union members, Reuters reports, citing an Irish government agency report.

Meanwhile, the European Union (EU) citizens have missed the deadline to apply to stay in the UK, which could trigger a fresh Brexit backlash between the Kingdom and Brussels.

Looking ahead, the US dollar’s price action, Brexit updates and covid stats will continue to influence the major ahead of the Preliminary Michigan Consumer Sentiment data.

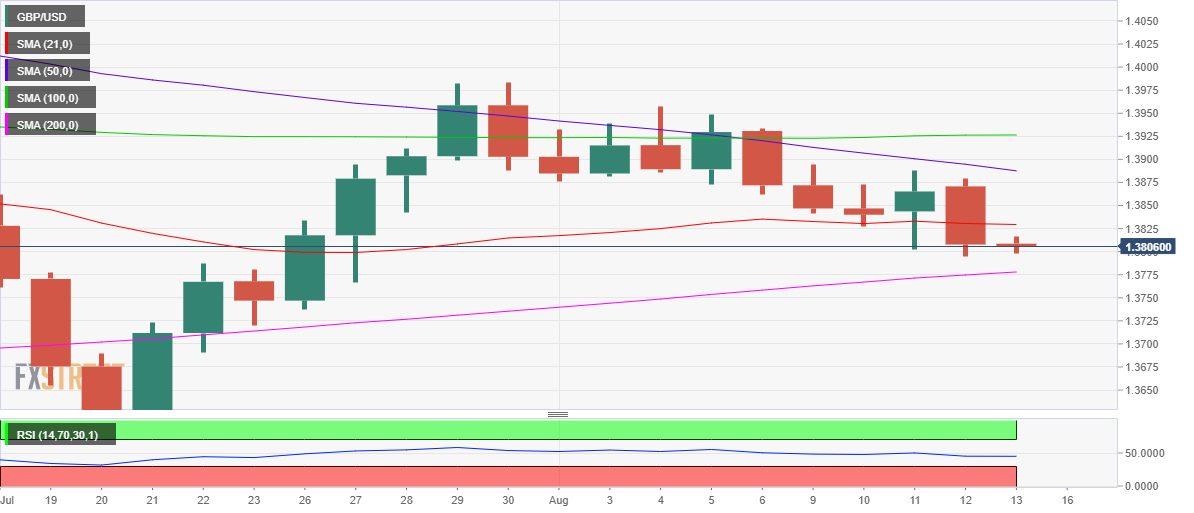
GBP/USD technical outlook

GBP/USD remains trapped in a narrow between the 21-Daily Moving Average (DMA) at 1.3829 on the upside while the losses appear capped by the ascending 200-DMA at 1.3777.

However, with the 14-day Relative Strength Index (RSI) still hovering below the midline, the odds for a potential downside seem higher.

A breach of the 200-DMA support could call for a test of the $1.3750 demand zone.

Alternatively, acceptance above the 21-DMA could reinforce recovery towards the downward-sloping 50-DMA at 1.3887.

GBP/USD daily chart

GBP/USD additional levels to watch

GBP/USD

Overview
Today last price 1.3805
Today Daily Change -0.0001
Today Daily Change % -0.01
Today daily open 1.3808
 
Trends
Daily SMA20 1.3831
Daily SMA50 1.3895
Daily SMA100 1.3926
Daily SMA200 1.3775
 
Levels
Previous Daily High 1.3879
Previous Daily Low 1.3795
Previous Weekly High 1.3958
Previous Weekly Low 1.3861
Previous Monthly High 1.3984
Previous Monthly Low 1.3572
Daily Fibonacci 38.2% 1.3827
Daily Fibonacci 61.8% 1.3847
Daily Pivot Point S1 1.3775
Daily Pivot Point S2 1.3743
Daily Pivot Point S3 1.3692
Daily Pivot Point R1 1.3859
Daily Pivot Point R2 1.3911
Daily Pivot Point R3 1.3943


Share: Feed news

Information on these pages contains forward-looking statements that involve risks and uncertainties. Markets and instruments profiled on this page are for informational purposes only and should not in any way come across as a recommendation to buy or sell in these assets. You should do your own thorough research before making any investment decisions. FXStreet does not in any way guarantee that this information is free from mistakes, errors, or material misstatements. It also does not guarantee that this information is of a timely nature. Investing in Open Markets involves a great deal of risk, including the loss of all or a portion of your investment, as well as emotional distress. All risks, losses and costs associated with investing, including total loss of principal, are your responsibility. The views and opinions expressed in this article are those of the authors and do not necessarily reflect the official policy or position of FXStreet nor its advertisers. The author will not be held responsible for information that is found at the end of links posted on this page.

If not otherwise explicitly mentioned in the body of the article, at the time of writing, the author has no position in any stock mentioned in this article and no business relationship with any company mentioned. The author has not received compensation for writing this article, other than from FXStreet.

FXStreet and the author do not provide personalized recommendations. The author makes no representations as to the accuracy, completeness, or suitability of this information. FXStreet and the author will not be liable for any errors, omissions or any losses, injuries or damages arising from this information and its display or use. Errors and omissions excepted.

The author and FXStreet are not registered investment advisors and nothing in this article is intended to be investment advice.

Recommended content


Recommended content

Editors’ Picks

AUD/USD retargets the 0.6600 barrier and above

AUD/USD retargets the 0.6600 barrier and above

AUD/USD extended its positive streak for the sixth session in a row at the beginning of the week, managing to retest the transitory 100-day SMA near 0.6580 on the back of the solid performance of the commodity complex.

AUD/USD News

EUR/USD keeps the bullish bias above 1.0700

EUR/USD keeps the bullish bias above 1.0700

EUR/USD rapidly set aside Friday’s decline and regained strong upside traction in response to the marked retracement in the Greenback following the still-unconfirmed FX intervention by the Japanese MoF.

EUR/USD News

Gold advances for a third consecutive day

Gold advances for a third consecutive day

Gold fluctuates in a relatively tight channel above $2,330 on Monday. The benchmark 10-year US Treasury bond yield corrects lower and helps XAU/USD limit its losses ahead of this week's key Fed policy meeting.

Gold News

Bitcoin price dips to $62K range despite growing international BTC validation via spot ETFs

Bitcoin price dips to $62K range despite growing international BTC validation via spot ETFs

Bitcoin (BTC) price closed down for four weeks in a row, based on the weekly chart, and could be on track for another red candle this week. The last time it did this was in the middle of the bear market when it fell by 42% within a span of nine weeks. 

Read more

Japan intervention: Will it work?

Japan intervention: Will it work?

Dear Japan Intervenes in the Yen for the first time since November 2022 Will it work? Have we seen a top in USDJPY? Let's go through the charts.

Read more

Forex MAJORS

Cryptocurrencies

Signatures