GBP/USD Price Analysis: Trades with modest losses, holds above 1.2000 ahead of UK/US PMIs
- GBP/USD edges lower on Tuesday and stalls a two-day-old recovery trend from a multi-week low.
- Hawkish Fed expectations, recession fears underpin the safe-haven USD and exert some pressure.
- The technical setup favours bearish traders and supports prospects for a further depreciating move.

The GBP/USD pair comes under some selling pressure on Tuesday and stalls its recent recovery from the 1.1915 area, or the lowest level since January 6, touched last week.
Spot prices remain on the defensive through the early European session, though manage to hold above the 1.2000 psychological mark, at least for the time being.
The US Dollar continues to draw support from rising bets for further policy tightening by the Fed and looming recession risks.
Apart from this, speculations that the Bank of England's (BoE) current rate-hiking cycle might be nearing the end undermine the British Pound and contribute to a mildly offered tone around the GBP/USD pair.
The downside, however, remains cushioned as traders seem reluctant to place aggressive directional bets ahead of the release of the FOMC meeting minutes on Wednesday.
Heading into this key event risk, the flash version of the PMI prints from the UK and the US could produce short-term opportunities around the GBP/USD pair on Tuesday.
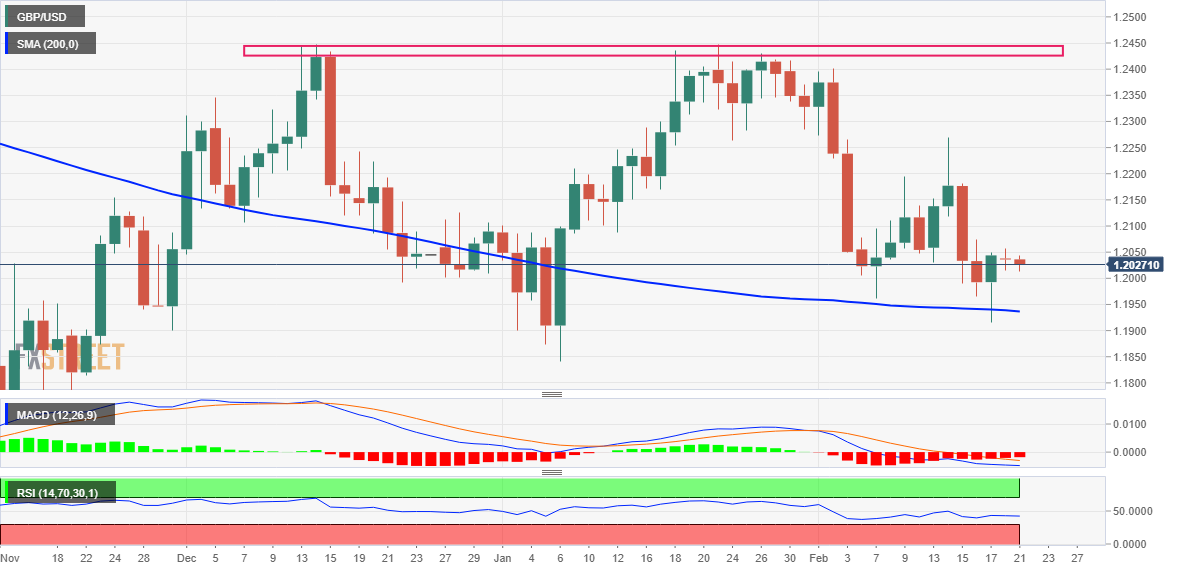
From a technical perspective, any subsequent downfall is likely to find decent support near the very important 200-day SMA, currently around the 1.1935 region.
This is closely followed by last Friday's swing low, around the 1.1915 zone and the 1.1900 mark, which if broken decisively (being the bottom of a textbook hammer candlestick) should pave the way for a further depreciating move.
Against the backdrop of the recent failures near the 1.2450 area, which constitute the formation of a bearish double top, the downfall will mark a fresh breakdown.
The GBP/USD pair might then accelerate the slide towards the YTD low, around the 1.1840 region touched in January and extend the downward trajectory towards the 1.1800 round figure.
On the flip side, the 1.2050-1.2055 region now seems to have emerged as an immediate hurdle. This is followed by the 1.2070-1.2075 resistance zone and the 1.2100 mark. A sustained strength beyond the latter has the potential to lift the GBP/USD pair beyond the 1.2130-1.2135 barrier, towards the 50-day SMA, currently around the 1.2170 area.
The latter should act as a pivotal point, which if cleared could trigger a near-term short-covering rally.
The GBP/USD pair might then reclaim the 1.2200 mark and climb further to the last week's swing high, around the 1.2265-1.2270 region, before aiming to reclaim the 1.2300 round-figure mark.
GBP/USD daily chart
Key levels to watch
Author

Haresh Menghani
FXStreet
Haresh Menghani is a detail-oriented professional with 10+ years of extensive experience in analysing the global financial markets.