GBP/USD Price Analysis: Tests the upside break of triangle near 1.1350


  • An explosion of a neutral triangle results in wider ticks and heavy volume.
  • A bull cross, represented by 20-and 50-EMAs, indicates more upside ahead.
  • For a confident upside, the RSI (14) is needed to sustain in the bullish range of 60.00-80.00.

The GBP/USD pair is displaying back-and-forth moves in a narrow range of 1.1344-1.1370 in the Tokyo session. The asset has turned sideways following the footprints of the US dollar index (DXY), which is indicating volatility contraction. The risk-off market mood is gaining more traction as S&P500 futures have extended their gains. Also, the 10-year US Treasury yields have surrendered the crucial support of 4% despite firmer bets for hawkish Federal Reserve (Fed) policy.

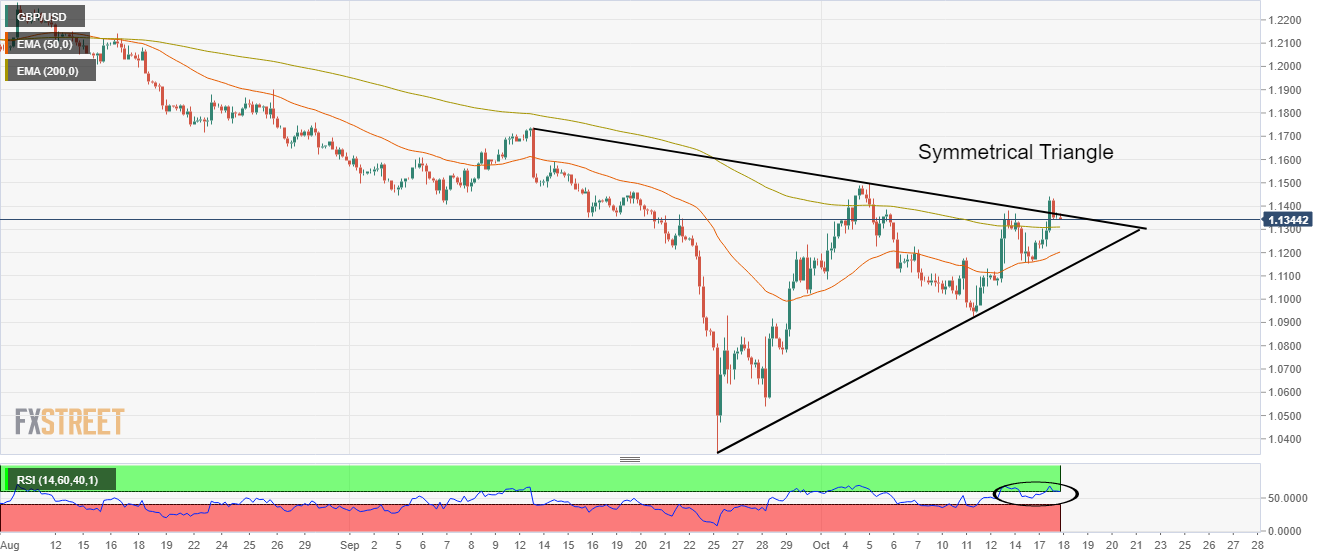
On a four-hour scale, the pound bulls are testing the north-side break of the symmetrical triangle chart pattern.  The downward-sloping trendline of the above-mentioned chart pattern is placed from September 13 high at 1.1738 while the upward-sloping trendline is plotted from September 26 low at 1.0339. An explosion of a neutral triangle results in wider ticks and heavy volume.

A bull cross, represented by the 20-and 50-period Exponential Moving Averages (EMAs) at 1.1125, adds to the upside filters.

Adding to that, the Relative Strength Index (RSI) (14) has shifted into the bullish range of 60.00-80.00 but requires sustaining in the range comfortably.

Going forward, an upside break of Monday’s high at 1.1440 will drive the cable towards September 14 high at 1.1590, followed by September 13 high at 1.1738.

On the flip side, a drop below the 50-EMA at 1.1200 will drag the asset toward the psychological support of 1.1000. If cable surrenders the psychological support, it will expose to more downside towards October 12 low at 1.0924.

GBP/USD four-hour chart

GBP/USD

Overview
Today last price 1.1344
Today Daily Change -0.0012
Today Daily Change % -0.11
Today daily open 1.1356
 
Trends
Daily SMA20 1.1135
Daily SMA50 1.15
Daily SMA100 1.1835
Daily SMA200 1.2467
 
Levels
Previous Daily High 1.144
Previous Daily Low 1.1171
Previous Weekly High 1.1381
Previous Weekly Low 1.0924
Previous Monthly High 1.1738
Previous Monthly Low 1.0339
Daily Fibonacci 38.2% 1.1337
Daily Fibonacci 61.8% 1.1274
Daily Pivot Point S1 1.1204
Daily Pivot Point S2 1.1053
Daily Pivot Point S3 1.0936
Daily Pivot Point R1 1.1473
Daily Pivot Point R2 1.1591
Daily Pivot Point R3 1.1742


Share: Feed news

Information on these pages contains forward-looking statements that involve risks and uncertainties. Markets and instruments profiled on this page are for informational purposes only and should not in any way come across as a recommendation to buy or sell in these assets. You should do your own thorough research before making any investment decisions. FXStreet does not in any way guarantee that this information is free from mistakes, errors, or material misstatements. It also does not guarantee that this information is of a timely nature. Investing in Open Markets involves a great deal of risk, including the loss of all or a portion of your investment, as well as emotional distress. All risks, losses and costs associated with investing, including total loss of principal, are your responsibility. The views and opinions expressed in this article are those of the authors and do not necessarily reflect the official policy or position of FXStreet nor its advertisers. The author will not be held responsible for information that is found at the end of links posted on this page.

If not otherwise explicitly mentioned in the body of the article, at the time of writing, the author has no position in any stock mentioned in this article and no business relationship with any company mentioned. The author has not received compensation for writing this article, other than from FXStreet.

FXStreet and the author do not provide personalized recommendations. The author makes no representations as to the accuracy, completeness, or suitability of this information. FXStreet and the author will not be liable for any errors, omissions or any losses, injuries or damages arising from this information and its display or use. Errors and omissions excepted.

The author and FXStreet are not registered investment advisors and nothing in this article is intended to be investment advice.

Recommended content


Recommended content

Editors’ Picks

EUR/USD edges lower toward 1.0700 post-US PCE

EUR/USD edges lower toward 1.0700 post-US PCE

EUR/USD stays under modest bearish pressure but manages to hold above 1.0700 in the American session on Friday. The US Dollar (USD) gathers strength against its rivals after the stronger-than-forecast PCE inflation data, not allowing the pair to gain traction.

EUR/USD News

GBP/USD retreats to 1.2500 on renewed USD strength

GBP/USD retreats to 1.2500 on renewed USD strength

GBP/USD lost its traction and turned negative on the day near 1.2500. Following the stronger-than-expected PCE inflation readings from the US, the USD stays resilient and makes it difficult for the pair to gather recovery momentum.

GBP/USD News

Gold struggles to hold above $2,350 following US inflation

Gold struggles to hold above $2,350 following US inflation

Gold turned south and declined toward $2,340, erasing a large portion of its daily gains, as the USD benefited from PCE inflation data. The benchmark 10-year US yield, however, stays in negative territory and helps XAU/USD limit its losses. 

Gold News

Bitcoin Weekly Forecast: BTC’s next breakout could propel it to $80,000 Premium

Bitcoin Weekly Forecast: BTC’s next breakout could propel it to $80,000

Bitcoin’s recent price consolidation could be nearing its end as technical indicators and on-chain metrics suggest a potential upward breakout. However, this move would not be straightforward and could punish impatient investors. 

Read more

Week ahead – Hawkish risk as Fed and NFP on tap, Eurozone data eyed too

Week ahead – Hawkish risk as Fed and NFP on tap, Eurozone data eyed too

Fed meets on Wednesday as US inflation stays elevated. Will Friday’s jobs report bring relief or more angst for the markets? Eurozone flash GDP and CPI numbers in focus for the Euro.

Read more

Forex MAJORS

Cryptocurrencies

Signatures