GBP/USD Price Analysis: Retreats towards 1.2050 inside weekly triangle


  • GBP/USD snaps two-day winning streak with mild losses.
  • Another failure to cross 200-SMA triggers pullback inside one-week-old symmetrical triangle.
  • Firmer oscillators, 1.2000 psychological magnet challenge the Cable bears.

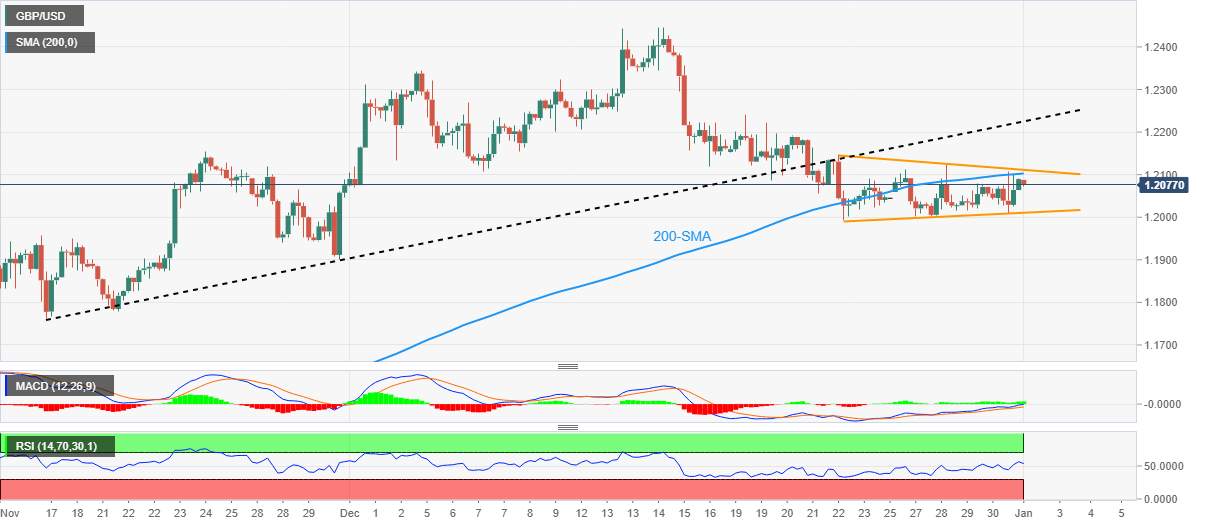
GBP/USD begins 2023 on a back foot as it prints mild losses near 1.2080 during the early hours of Monday. In doing so, the Cable pair justifies the previous day’s failure to cross the 200-SMA inside a one-week-old symmetrical triangle formation.

That said, the 200-SMA level, around 1.2100 by the press time, precedes the stated triangle’s upper line near 1.2110 to restrict short-term advances of the GBP/USD prices.

It’s worth noting, however, that the bullish MACD signals and the firmer RSI (14), not overbought, join the 1.2000 psychological magnet to limit the Cable pair’s immediate downside.

Hence, the GBP/USD may remain uninteresting between 1.2110 and 1.2000.

That said, the previous support line from November 17, close to 1.2225 at the latest, adds to the upside filters before giving control to the GBP/USD bulls.

In that case, the quote could challenge December’s peak of 1.2446, a break of which could help the bulls to aim for a May 2022 high of around 1.2665.

On the flip side, a clear downside break of the 1.2000 threshold may direct the GBP/USD bears towards the late November swing low of 1.1900 before highlighting the mid-November swing low near 1.1760.

GBP/USD: Four-hour chart

Trend: Limited downside expected

Additional important levels

Overview
Today last price 1.2077
Today Daily Change -0.0013
Today Daily Change % -0.11%
Today daily open 1.209
 
Trends
Daily SMA20 1.2158
Daily SMA50 1.1906
Daily SMA100 1.1667
Daily SMA200 1.2046
 
Levels
Previous Daily High 1.2108
Previous Daily Low 1.201
Previous Weekly High 1.2126
Previous Weekly Low 1.2002
Previous Monthly High 1.2447
Previous Monthly Low 1.1992
Daily Fibonacci 38.2% 1.207
Daily Fibonacci 61.8% 1.2047
Daily Pivot Point S1 1.203
Daily Pivot Point S2 1.1971
Daily Pivot Point S3 1.1933
Daily Pivot Point R1 1.2128
Daily Pivot Point R2 1.2167
Daily Pivot Point R3 1.2226


Share: Feed news

Information on these pages contains forward-looking statements that involve risks and uncertainties. Markets and instruments profiled on this page are for informational purposes only and should not in any way come across as a recommendation to buy or sell in these assets. You should do your own thorough research before making any investment decisions. FXStreet does not in any way guarantee that this information is free from mistakes, errors, or material misstatements. It also does not guarantee that this information is of a timely nature. Investing in Open Markets involves a great deal of risk, including the loss of all or a portion of your investment, as well as emotional distress. All risks, losses and costs associated with investing, including total loss of principal, are your responsibility. The views and opinions expressed in this article are those of the authors and do not necessarily reflect the official policy or position of FXStreet nor its advertisers. The author will not be held responsible for information that is found at the end of links posted on this page.

If not otherwise explicitly mentioned in the body of the article, at the time of writing, the author has no position in any stock mentioned in this article and no business relationship with any company mentioned. The author has not received compensation for writing this article, other than from FXStreet.

FXStreet and the author do not provide personalized recommendations. The author makes no representations as to the accuracy, completeness, or suitability of this information. FXStreet and the author will not be liable for any errors, omissions or any losses, injuries or damages arising from this information and its display or use. Errors and omissions excepted.

The author and FXStreet are not registered investment advisors and nothing in this article is intended to be investment advice.

Recommended content


Recommended content

Editors’ Picks

EUR/USD extends sideways grind below 1.0900

EUR/USD extends sideways grind below 1.0900

EUR/USD stays in a consolidation phase below 1.0900 following the previous week's rally. In the absence of high-tier data releases, the US Dollar stays resilient against its rivals as investors scrutinize comments from central bank officials. 

EUR/USD News

Gold pulls away from record highs, holds above $2,400

Gold pulls away from record highs, holds above $2,400

Gold rose sharply at the beginning of the week on escalating geopolitical tensions and touched a new all-time high of $2,450. With market mood improving modestly, XAU/USD erases a majority of its daily gains but manages to hold above $2,400.

Gold News

GBP/USD holds steady near 1.2700, Fedspeak in focus

GBP/USD holds steady near 1.2700, Fedspeak in focus

GBP/USD fluctuates in a narrow channel near 1.2700 on the first trading day of the week. The cautious market stance helps the US Dollar hold its ground, while market participants assess remarks from central bank officials ahead of this week's key events.

GBP/USD News

Ripple stays above $0.50 on Monday as firm backs research on blockchain and quantum computing

Ripple stays above $0.50 on Monday as firm backs research on blockchain and quantum computing

XRP price holds steady above the $0.50 key support level and edges higher on Monday, trading at 0.5130 and rising 0.70% in the day at the time of writing.

Read more

Week ahead: Nvidia results and UK CPI falling back to target

Week ahead: Nvidia results and UK CPI falling back to target

What a week for investors. The Dow Jones reached a record high and closed last week above 40,000, for the first time ever. This is a major bullish signal even though gains for global stocks were fairly modest on Friday, and European stocks closed lower. 

Read more

Forex MAJORS

Cryptocurrencies

Signatures