|

GBP/USD Price Analysis: Recovers early lost ground, bulls await a move beyond 1.3500 mark

  • GBP/USD attracted some dip-buying on Thursday and recovered the early lost ground.
  • The technical setup favours bullish trades and supports prospects for additional gains.
  • A sustained break below the 1.3400 round figure is needed to negate the positive bias.

The GBP/USD pair recovered intraday losses and was last seen trading in the neutral territory, just below the key 1.3500 psychological mark, or the monthly high touched earlier this Thursday.

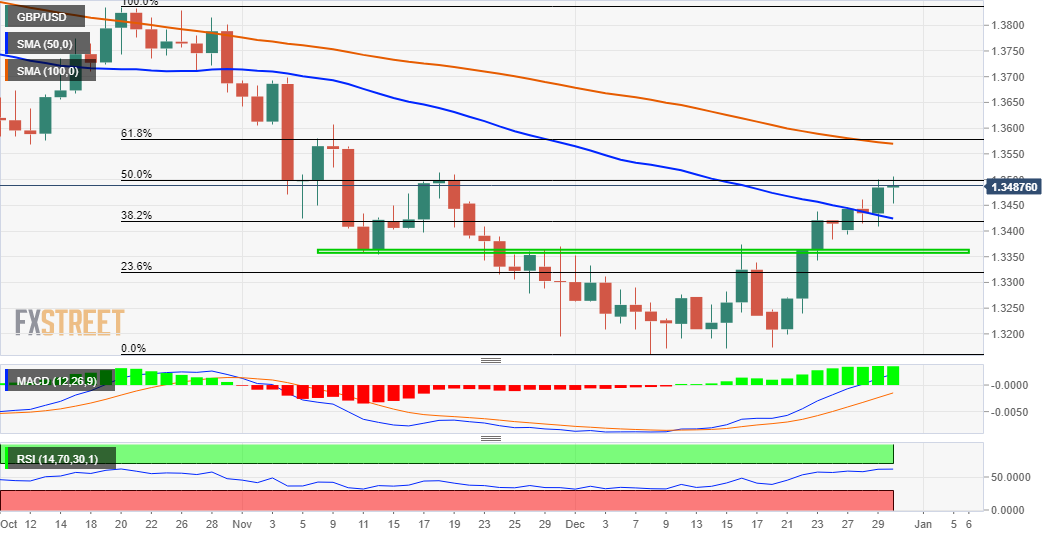
Looking at the broader picture, the recent strong recovery move from the YTD low paused near a hurdle marked by the 50% Fibonacci level of the 1.3834-1.3161 downfall. This coincides with the November 19 swing high and should act as a key pivotal point for short-term traders.

Given the recent move beyond the 1.3375-80 barrier, the overnight sustained breakthrough the 38.2% Fibo. and the 50-day SMA confluence favours bullish traders. This along with positive oscillators supports prospects for a further near-term appreciating move for the GBP/USD pair.

Hence, a subsequent strength towards the next relevant resistance, near the 1.3565 region, remains a distinct possibility. The mentioned area comprises 61.8% Fibo. level and the 100-day SMA, which if cleared decisively would be seen as a fresh trigger for bullish traders.

On the flip side, the daily swing low, around the 1.3455-50 region, now seems to protect the immediate downside. Any subsequent decline could be seen as a buying opportunity near the 38.2% Fibo. level/50-DMA confluence resistance breakpoint and remain limited near the 1.3400 mark.

Failure to defend the mentioned support levels, leading to a further slide below the 1.3385-75 region might shift the bias back in favour of bearish traders. The GBP/USD pair could then accelerate the fall towards testing the 23.6% Fibo. level, around the 1.3320 area.

GBP/USD daily chart

fxsoriginal

Levels to watch

GBP/USD

Overview
Today last price1.3488
Today Daily Change0.0003
Today Daily Change %0.02
Today daily open1.3485
 
Trends
Daily SMA201.3302
Daily SMA501.3431
Daily SMA1001.3573
Daily SMA2001.3749
 
Levels
Previous Daily High1.35
Previous Daily Low1.3409
Previous Weekly High1.3438
Previous Weekly Low1.3174
Previous Monthly High1.3698
Previous Monthly Low1.3194
Daily Fibonacci 38.2%1.3465
Daily Fibonacci 61.8%1.3443
Daily Pivot Point S11.3429
Daily Pivot Point S21.3373
Daily Pivot Point S31.3338
Daily Pivot Point R11.352
Daily Pivot Point R21.3555
Daily Pivot Point R31.3611

Author

Haresh Menghani

Haresh Menghani is a detail-oriented professional with 10+ years of extensive experience in analysing the global financial markets.

More from Haresh Menghani
Share:

Editor's Picks

EUR/USD rebounds from session lows, stays below 1.1650

EUR/USD is recovers modestly from session lows but remains in the red below 1.1650 in European trading on Thursday. The pair faces headwinds from a renewed uptick in the US Dollar amid a negative shift in risk sentiment. Surging energy prices due to the Middle East war keep the bearish pressure intact on the Euro. The US Jobless Claims data are next of note. 

GBP/USD stays weak near 1.3350 amid UK stagflation risks

GBP/USD sticks to losses near 1.3350 in the European session on Thursday. The Pound Sterling loses ground amid fears that the United Kingdom economy could face stagflation risks due to higher energy prices, while the US Dollar attracts fresh havem demand ahead of the US Jobless Claims data. 

Gold climbs near $5,200 as Iran war fuels safe-haven demand

Gold price extends its gains for the second successive session on Thursday as traders seek safety amid the ongoing war in the Middle East. US and Israeli strikes across Iranian territory and widespread Iranian missile and drone retaliation across the Middle East, including attacks on regional targets and military sites, prolong the crisis and its impact.

Three reasons to be bearish on Bitcoin

Bitcoin is holding up well taking into account the uncertainty stemming from the Middle East. Despite this week’s rally, the long-term outlook remains bearish. Here are three reasons why I think the storm for the largest cryptocurrency isn't over yet.

FX alert: When Energy still writes the macro script the Dollar holds the pen

The market is quietly sliding back into the trade nobody wanted to own, but everyone now has to respect again. The no quick off-ramp trade. Yesterday’s bounce in risk assets already looks less like a turning point and more like a classic relief rally in a market that briefly inhaled before realizing the room was still on fire.

Cardano Price Analysis: Approaches key trendline amid bearish sentiment

Cardano (ADA) price is approaching its descending trendline around $0.28 at the time of writing, set to shape the next directional move. The derivatives metrics paint a bearish picture, with ADA’s Open Interest continuing to fall and short bets rising among traders.