|

GBP/USD Price Analysis: Recovers above 1.2500 as ‘hammer’ hints buyers in charge

  • GBP/USD has been trading volatile after the BoE’s decision; stands above 1.2500.
  • BoE’s Bailey sounded dovish after stating they would need to lower rates below what’s priced in.
  • Thursday’s price action is forming a ‘hammer,’ hinting further upside is seen.
GBP/USD Price Analysis: Recovers above 1.2500 as ‘hammer’ hints buyers in charge

The Pound Sterling erased some of its earlier losses against the US Dollar and edged up by 0.03% after the Bank of England’s (BoE) monetary policy decision. The GBP/USD traded at 1.2503 after hitting a low of 1.2445.

Earlier, the BoE held rates unchanged in a 7-2 split vote, with David Ramsden and Swati Dhingra voting for a quarter of a percentage point. After releasing its monetary policy statement, the BoE hosted a press conference. BoE Governor Andrew Bailey stated the central bank would need to cut rates more than it is currently priced by market rates.

GBP/USD Price Analysis: Technical outlook

Given the fundamental backdrop, the GBP/USD remains neutral with a downward bias, with the pair failing to crack the 200-day moving average (DMA) decisively. Even though momentum favors sellers, as depicted by the Relative Strength Index (RSI) being in bearish territory, they would also need to push the exchange rate back below 1.2500.

In that outcome, the GBP/USD next support would be the May 9 low of 1.2445, followed by the 1.2400 figure. Below this level, the next major support level emerges at the year-to-date (YTD) low of 1.2299.

It should be said that today’s price action is forming a ‘hammer.’ With that said, if buyers clear the 200-DMA at 1.2542, the next resistance would be the confluence of the May 6 high and the 50-DMA at around 1.2594/1.2600. Once cleared, the 100-DMA at 1.2634 would follow.

GBP/USD Price Action – Daily Chart
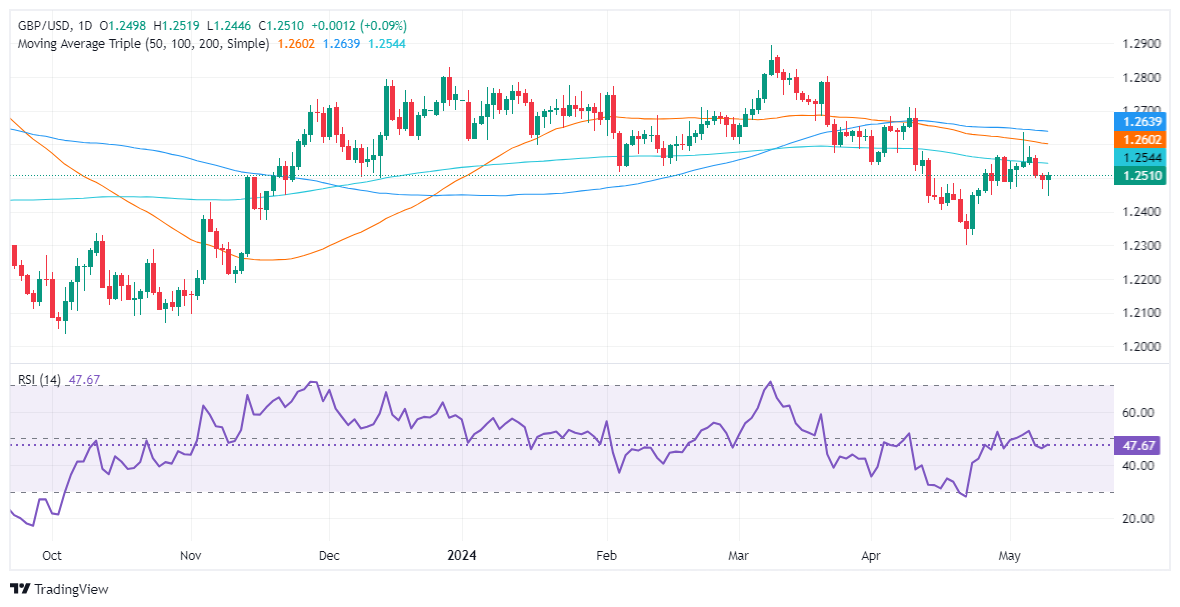
GBP/USD

Overview
Today last price1.2509
Today Daily Change0.0011
Today Daily Change %0.09
Today daily open1.2498
 
Trends
Daily SMA201.2482
Daily SMA501.2604
Daily SMA1001.264
Daily SMA2001.2545
 
Levels
Previous Daily High1.2516
Previous Daily Low1.2468
Previous Weekly High1.2635
Previous Weekly Low1.2466
Previous Monthly High1.2709
Previous Monthly Low1.23
Daily Fibonacci 38.2%1.2486
Daily Fibonacci 61.8%1.2497
Daily Pivot Point S11.2472
Daily Pivot Point S21.2446
Daily Pivot Point S31.2424
Daily Pivot Point R11.252
Daily Pivot Point R21.2542
Daily Pivot Point R31.2568

Author

Christian Borjon Valencia

Markets analyst, news editor, and trading instructor with over 14 years of experience across FX, commodities, US equity indices, and global macro markets.


More from Christian Borjon Valencia
Share:

Editor's Picks

AUD/USD remains depressed below 0.6750 after RBA minutes

AUD/USD treads water below 0.6750 in Asia on Tuesday, struggling near ten-month lows. The pair fails to find any inspiration from RBA Governor Bullock’s hawkish remarks. Moreover, Minutes from the November RBA meeting also had little impact on the Australian Dollar amid a bullish US Dollar undertone, bolstered by firming Fed hike bets and geopolitical uncertainties.

USD/JPY holds steady around 156.50 as 'Yentervention' risks loom

USD/JPY is consolidating around mid-156.00s in the Asian session on Tuesday as traders stay on high alert amid speculation that authorities will step in to support the Japanese Yen. Meanwhile, the US Dollar holds its recent gains at a 19-month high, amid firming Fed rate-hike bets and geopolitical uncertainty. This, along with the wide US-Japan rate differential, acts as a tailwind for the pair.


Gold clings to modest recovery gains; eyes $3,900 as USD retreats from 19-month high

Gold builds on its steady intraday ascent through the Asian session, recovering further from its lowest level since October 2025 amid a modest US Dollar pullback from a 19-month high. However, firming US Federal Reserve rate-hike expectations and geopolitical uncertainties could limit any meaningful USD fall. This should cap any meaningful appreciation for the precious metal, warranting caution for bullish traders.

Pi Network sinks to record low of $0.0551 as bears dominate

Pi Network extends its losing streak, hitting a new all-time low of $0.0551 on Tuesday as bearish pressure intensifies. Weakening derivatives metrics suggest bears remain in control. In addition, deteriorating technical indicators point to elevated downside risk, despite oversold conditions that could trigger a short-term relief bounce.

The week ahead: Questions for the new Nvidia CEO, Anthropic’s IPO and economic data dump
The tech stock rout does not look to be over, and could be broadening as we start a new week. Nvidia’s stock price is lower by another 2% in the pre market, and its rivals, that had benefited from the chip giant’s initial demise, are also playing catch up this morning. AMD’s share price is lower by 4.2% in early trading, even though it eked out a gain last week.
Gold isn't being sold for thew reason most people think
Gold (XAU/USD) remains under heavy selling pressure on Monday, hitting its lowest level in 13 months. The precious metal is struggling to recover despite escalating geopolitical tensions in the Middle East, a backdrop that would normally encourage investors to seek protection in safe-haven assets. However, the main driver behind Gold's decline is not the geopolitical uncertainty itself.