|

GBP/USD Price Analysis: Pound Sterling portrays pre-data consolidation below 1.2680 hurdle

  • GBP/USD buyers seek fresh clues after cheering the biggest daily jump in three weeks.
  • Successful rebound from 15-week-old horizontal support, upbeat oscillators keep Cable buyers hopeful.
  • 50-SMA will test immediate upside of the Pound Sterling before the key resistance line.
  • British Consumer Credit, key US employment, inflation clues eyed for clear directions.

GBP/USD seesaws around 1.2650 after rising the most in three weeks the previous day. In doing so, the Cable pair portrays the market’s cautious mood ahead of a slew of statistics from the UK and the US.

It’s worth noting that the Pound Sterling’s extension of Friday’s rebound from a horizontal support zone comprising the tops marked in May and June, around 1.2550, joins the bullish MACD signals and the upbeat RSI (14) line to keep the buyers hopeful.

However, the 50-SMA level of around 1.2675 will test the GBP/USD pair’s immediate upside ahead of a one-month-old descending resistance line surrounding 1.2740.

In a case where the Cable remains firmer past 1.2740, the 200-SMA level of around 1.2780 and the August 10 peak of near 1.2820 will be on the bull’s radar.

On the flip side, the GBP/USD pair’s pullback may initially aim for the three-week-old support line surrounding 1.2600 before challenging the aforementioned key horizontal trend line comprising levels marked since mid-May, close to 1.2550 at the latest.

Should the Pound Sterling remain weak past 1.2550, the odds of witnessing a quick drop to the mid-June swing low of around 1.2485 can’t be ruled out.

That said, the UK Consumer Credit for July will entertain GBP/USD ahead of the US ADP Employment Change, the final readings of the US second quarter (Q2) Gross Domestic Product (GDP) and the Personal Consumption Expenditure (PCE).

Also read: GBP/USD regains the 100-day SMA as US yields sink

GBP/USD: Four-hour chart
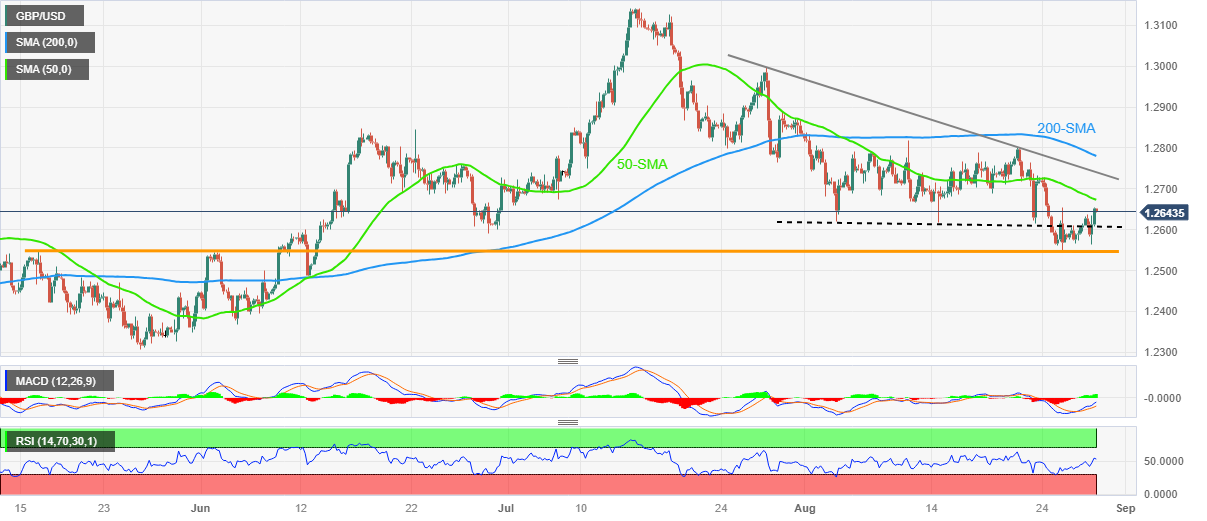
Trend: Further upside expected

Additional important levels

Overview
Today last price1.2644
Today Daily Change0.0042
Today Daily Change %0.33%
Today daily open1.2602
 
Trends
Daily SMA201.2708
Daily SMA501.2784
Daily SMA1001.2642
Daily SMA2001.2403
 
Levels
Previous Daily High1.2611
Previous Daily Low1.2566
Previous Weekly High1.28
Previous Weekly Low1.2548
Previous Monthly High1.3142
Previous Monthly Low1.2659
Daily Fibonacci 38.2%1.2594
Daily Fibonacci 61.8%1.2583
Daily Pivot Point S11.2575
Daily Pivot Point S21.2547
Daily Pivot Point S31.2529
Daily Pivot Point R11.262
Daily Pivot Point R21.2638
Daily Pivot Point R31.2665

Author

Anil Panchal

Anil Panchal

FXStreet

Anil Panchal has nearly 15 years of experience in tracking financial markets. With a keen interest in macroeconomics, Anil aptly tracks global news/updates and stays well-informed about the global financial moves and their implications.


More from Anil Panchal
Share:

Editor's Picks

GBP/USD hovers around daily lows near 1.3450

GBP/USD trades with decent losses on Thursday, revisiting the 1.3450 zone. Cable’s resumption of the selling interest comes after two daily advances in a row and follows the improved sentiment around the Greenback amid fresh concerns in the Middle East.

EUR/USD slips back to two-day lows near 1.1510

EUR/USD faces some renewed downside pressure and retests the low 1.1500s in the latter part of Thursday’s NA session. The move lower in spot comes after two daily advances in a row and follows the fresh bid bias in the US Dollar amid the re-emergence of some effervescence in the Middle East. Moving forward, US NFP data will take centre stage on Friday.

How Wall Street rigs the game [Video]

In this week’s Live from the Vault, Andrew Maguire is joined by Peter Antico and Sean Stone to discuss the Paradigm of Money - an in-depth expose of financial market corruption, from naked shorting to the two-tier system that protects Wall Street.

Dogecoin Price Forecast: DOGE sell-off seems unstoppable despite renewed retail interest
Dogecoin (DOGE) is trading under dominant selling pressure on Thursday, hovering below $0.0700, a recent support-turned-resistance level. The meme coin has shed 3% of its value in the first week of August, against a backdrop of heavier selling pressure in previous months since May highs around $0.1186.
The Fed is doing the exact opposite of what it should be doing
About the Yen: The WSJ has a front-page story about how the Fed is doing the exact opposite of what it should be doing—lending dollars to Japan to buy yen. “Put simply: America is printing dollars so Japan can buy yen.
9-3: Is the Federal Reserve’s vote tally Warsh's new forward guidance?
The rate did not move. Neither did the statement, and that’s the more interesting fact. Set the July 29 Federal Open Market Committee (FOMC) statement beside the one issued on June 17, and the two documents are identical apart from a single verb and a paragraph at the bottom naming three dissenters.













