GBP/USD Price Analysis: Mildly bid around 1.2350 inside short-term rectangle
- GBP/USD snaps three-day downtrend around two-year low.
- Bears take a breather inside trend continuation pattern, bullish RSI hints at corrective pullback.
- 50-SMA, 13-day-old resistance line challenge recovery moves, weekly support line adds to the downside filters.

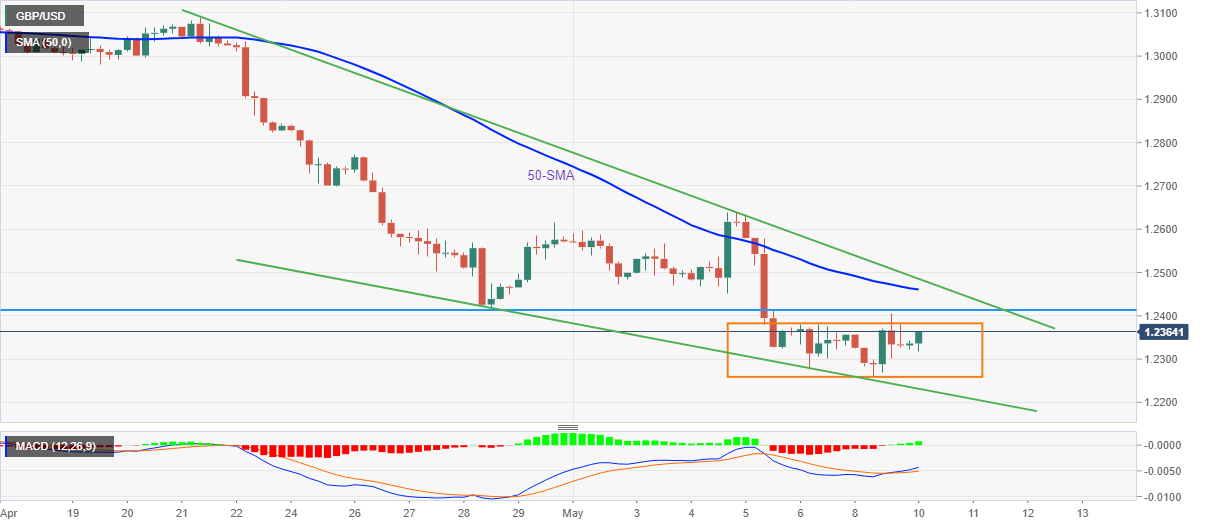
GBP/USD licks its wounds as sellers pause after refreshing a two-year low, picking up bids to 1.2360 inside an immediate rectangle formation.
In doing so, the cable pair prints the first daily gains in four underpinned by the bullish MACD signals.
However, the 50-SMA and upper line of a two-week-old falling wedge bullish chart pattern, respectively near 1.2460 and 1.2485, challenges the GBP/USD pair’s short-term rebound.
It’s worth noting, however, that the quote’s rally beyond 1.2485 confirms the bullish chart pattern and directs, theoretically, the upside momentum towards the 1.3200 level. During the rise, 1.2640, 1.2780 and the 1.3000 threshold may offer intermediate halts.
On the contrary, the support line of the three-day-old rectangle, near 1.2260 restricts the immediate downside of the GBP/USD prices.
Also acting as the short-term key support is the mentioned wedge’s lower line, close to 1.2230 by the press time.
In a case where GBP/USD drops below 1.2230, a south-run towards May 2020 lows near 1.2075 can’t be ruled out.
GBP/USD: Four-hour chart
Trend: Limited recovery expected
Author

Anil Panchal
FXStreet
Anil Panchal has nearly 15 years of experience in tracking financial markets. With a keen interest in macroeconomics, Anil aptly tracks global news/updates and stays well-informed about the global financial moves and their implications.


