GBP/USD Price Analysis: Licks wounds below 1.3500, 50-DMA support eyed


Share:
  • GBP/USD nurses losses amid a four-day downtrend, risk-aversion.
  • 50-DMA support at 1.3421 remains in sight if bears extend their control.
  • Bearish RSI points to additional downside, focus remains on the Fed.

GBP/USD is licking its wounds below 1.3500, as bears take a breather after the recent downward spiral to three-week lows of 1.3440.

Looming UK political concerns combined with intensifying risk-off mood hit the high-beta currency, the GBP, keeping the bearish tone intact around the cable.

NATO readying their forces in Eastern Europe, as the geopolitical tensions between Russia and Ukraine escalate, spooked markets and bolstered the safe-haven demand for the US dollar.

Further, the greenback also benefited from aggressive Fed rate hike expectations, as the world’s most powerful central bank is set to hint at policy normalization on Wednesday when it concludes its two-day meeting.

In the meantime, the broader market sentiment, Russia-Ukraine updates and the UK political developments will continue to influence the major.

Looking at GBP/USD’s daily chart, the pair remains exposed to downside risks, with a sustained break below Monday’s low of 1.3440 to unleash the additional declines towards the horizontal 100-Daily Moving Average (DMA) at 1.3421.

The 14-day Relative Strength Index (RSI) is inching lower below the midline, suggesting that there is more room to fall for the currency pair.          

The next significant support is seen at the round level of 1.3400.

GBP/USD: Daily chart

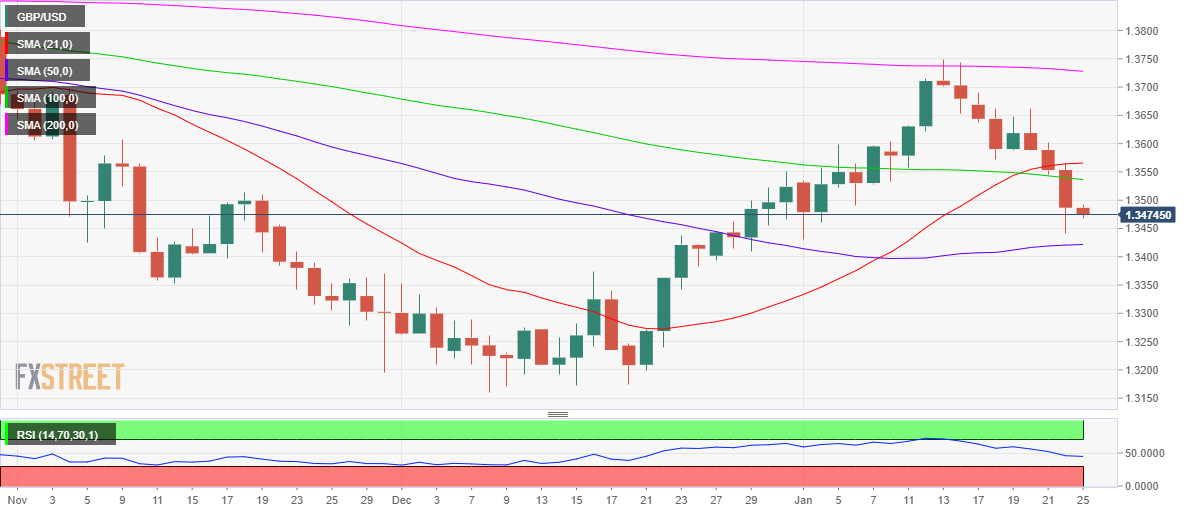
Alternatively, acceptance above mildly bearish 50-DMA at 1.3536 on a daily closing basis is critical to attempting any recovery from multi-week lows.

The 21-DMA at 1.3565 will then challenge the road to recovery, as bulls look to recapture the 1.3600 hurdle.

GBP/USD: Additional technical levels

GBP/USD

Overview
Today last price 1.3473
Today Daily Change -0.0014
Today Daily Change % -0.10
Today daily open 1.3487
 
Trends
Daily SMA20 1.357
Daily SMA50 1.3421
Daily SMA100 1.354
Daily SMA200 1.373
 
Levels
Previous Daily High 1.3566
Previous Daily Low 1.344
Previous Weekly High 1.369
Previous Weekly Low 1.3546
Previous Monthly High 1.355
Previous Monthly Low 1.3161
Daily Fibonacci 38.2% 1.3488
Daily Fibonacci 61.8% 1.3518
Daily Pivot Point S1 1.343
Daily Pivot Point S2 1.3372
Daily Pivot Point S3 1.3304
Daily Pivot Point R1 1.3555
Daily Pivot Point R2 1.3623
Daily Pivot Point R3 1.368


Share: Feed news

Information on these pages contains forward-looking statements that involve risks and uncertainties. Markets and instruments profiled on this page are for informational purposes only and should not in any way come across as a recommendation to buy or sell in these assets. You should do your own thorough research before making any investment decisions. FXStreet does not in any way guarantee that this information is free from mistakes, errors, or material misstatements. It also does not guarantee that this information is of a timely nature. Investing in Open Markets involves a great deal of risk, including the loss of all or a portion of your investment, as well as emotional distress. All risks, losses and costs associated with investing, including total loss of principal, are your responsibility. The views and opinions expressed in this article are those of the authors and do not necessarily reflect the official policy or position of FXStreet nor its advertisers. The author will not be held responsible for information that is found at the end of links posted on this page.

If not otherwise explicitly mentioned in the body of the article, at the time of writing, the author has no position in any stock mentioned in this article and no business relationship with any company mentioned. The author has not received compensation for writing this article, other than from FXStreet.

FXStreet and the author do not provide personalized recommendations. The author makes no representations as to the accuracy, completeness, or suitability of this information. FXStreet and the author will not be liable for any errors, omissions or any losses, injuries or damages arising from this information and its display or use. Errors and omissions excepted.

The author and FXStreet are not registered investment advisors and nothing in this article is intended to be investment advice.

Follow us on Telegram

Stay updated of all the news

Join Telegram

Recommended content


Follow us on Telegram

Stay updated of all the news

Join Telegram

Recommended content

Editors’ Picks

EUR/USD drops below 1.0800 ahead of key US jobs data

EUR/USD drops below 1.0800 ahead of key US jobs data

EUR/USD is dropping below 1.0800 in the European session on Wednesday. The pair is dragged by a renewed uptick in the US Dollar, as markets trade with caution ahead of a busy EU and US economic docket. US ADP is the key event risk. 

EUR/USD News

GBP/USD battles 1.2600, with eyes on US ADP data

GBP/USD battles 1.2600, with eyes on US ADP data

GBP/USD is trading close to 1.2600, snapping a two-day losing streak in European trading on Wednesday. The modest US Dollar decline acts as a tailwind for the pair but the Pound Sterling struggles amid a cautious market mood. US jobs data awaited. 

GBP/USD News

Gold finds buyers near $2,020, awaits US ADP jobs data

Gold finds buyers near $2,020, awaits US ADP jobs data

Gold is finding a floor near $2,020 early Wednesday, snapping a two-day correction from all-time highs of $2,144 set on Monday. XAU/USD price capitalizes on a broad US Dollar retreat, as Greenback buyers take a breather following this week’s upswing and ahead of the top-tier US ADP Employment Change data.

Gold News

Bitcoin-based meme coin ORDI price action wobbles after 1,100% rally

Bitcoin-based meme coin ORDI price action wobbles after 1,100% rally

The Bitcoin-based BRC-20 meme coin, which had people confused as being an actual valuable token, is now slowly creeping up to that status. ORDI price rise over the past couple of days has been astonishing, and with BTC driving the price and crossing $44,000, ORDI is also gaining rapidly. But not for long.

Read more

The Dollar is struggling to trend

The Dollar is struggling to trend

For the last three trading sessions, the dollar index has been crossing up and down the 200-day moving average every day. All in all, the flirting with this level has been going on for more than three weeks, during which neither bulls nor bears were able to form a stable trend.

Read more

Forex MAJORS

Cryptocurrencies

Signatures