|

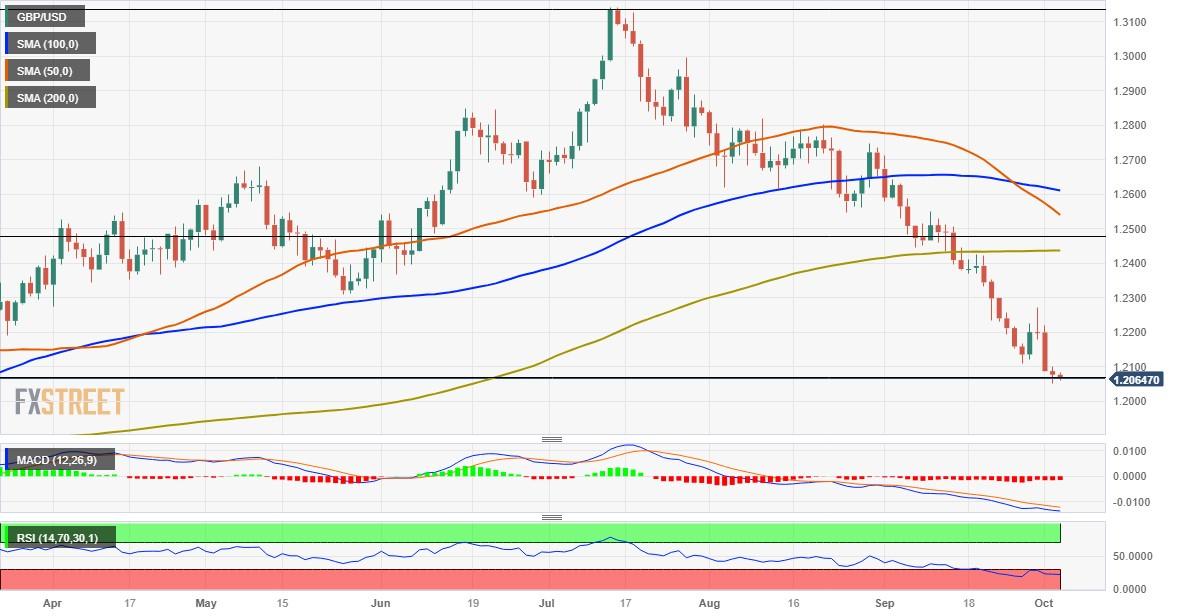
GBP/USD Price Analysis: Languishes near seven-month low, just above mid-1.2000s/38.2% Fibo.

  • GBP/USD is seen consolidating in a narrow band near a multi-month low touched on Tuesday.
  • The extremely oversold RSI on the daily chart holds back bearish traders from placing fresh bets.
  • The divergent Fed-BoE policy outlook supports prospects for an extension of the declining trend.

The GBP/USD pair struggles to register any meaningful recovery and languishes near its lowest level since March 16, around the 1.2050 area touched the previous day.

The prospects for further policy tightening by the Federal Reserve (Fed) remain supportive of elevated US Treasury bond yields and assist the US Dollar (USD) to stand tall near a 10-month high. This, along with the prevalent risk-off environment, is seen as another factor benefitting the Greenback's relative safe-haven status. Apart from this, the Bank of England's (BoE) surprise on-hold decision in September continues to undermine the British Pound (GBP) and acts as a headwind for the GBP/USD pair.

From a technical perspective, the Relative Strength Index (RSI) on the daily chart is flashing extremely oversold conditions and holding back traders from placing fresh bearish bets. Hence, it will be prudent to wait for some follow-through selling below mid-1.2000s, representing the 38.2% Fibonacci retracement level of the September 2022-July 2023 rally, before positioning for further losses. The GBP/USD pair might then accelerate the downfall further towards the 1.2000 psychological mark.

The next relevant support is pegged near the 1.1965 horizontal zone, which if broken decisively will be seen as a fresh trigger for bearish traders. The subsequent downfall has the potential to drag spot prices further towards the 1.1915 region en route to the 1.1900 mark. The GBP/USD pair could eventually drop to the 1.1800 neighbourhood, or the YTD low touched in March, en route to the 50% Fibo. level support near the 1.1740-1.1735 area.

On the flip side, any meaningful recovery beyond the 1.2100 mark is likely to confront a stiff hurdle near the 1.2140-1.2145 zone. A sustained strength beyond, however, could trigger a short-covering rally and allow the GBP/USD pair to reclaim the 1.2200 round figure. The momentum could get extended further, though might still be seen as a selling opportunity and runs the risk of fizzling out rather quickly near the last week's swing high, around the 1.2270 region.

GBP/USD daily chart

fxsoriginal

Technical levels to watch

GBP/USD

Overview
Today last price1.2066
Today Daily Change-0.0011
Today Daily Change %-0.09
Today daily open1.2077
 
Trends
Daily SMA201.2323
Daily SMA501.2557
Daily SMA1001.2615
Daily SMA2001.2437
 
Levels
Previous Daily High1.2102
Previous Daily Low1.2052
Previous Weekly High1.2272
Previous Weekly Low1.2111
Previous Monthly High1.2713
Previous Monthly Low1.2111
Daily Fibonacci 38.2%1.2071
Daily Fibonacci 61.8%1.2083
Daily Pivot Point S11.2052
Daily Pivot Point S21.2028
Daily Pivot Point S31.2003
Daily Pivot Point R11.2102
Daily Pivot Point R21.2127
Daily Pivot Point R31.2151

Author

Haresh Menghani

Haresh Menghani is a detail-oriented professional with 10+ years of extensive experience in analysing the global financial markets.

More from Haresh Menghani
Share:

Markets move fast. We move first.

Orange Juice Newsletter brings you expert driven insights - not headlines. Every day on your inbox.

By subscribing you agree to our Terms and conditions.

Editor's Picks

EUR/USD stays weak below 1.1700 on firmer US Dollar

EUR/USD remains under moderate selling pressure below 1.1700 in the European session on Monday. The pair weakens amidst resurgent haven demand for the US Dollar, following the US military intervention in Venezuela and the capture of President Nicolas Maduro. EU Sentix data and geopolitics remain in focus. 

GBP/USD falls toward 1.3400 near 50-day EMA

GBP/USD extends its losses for the second successive session, trading around 1.3420 during the Asian hours on Monday. The technical analysis of the daily chart indicates that the 14-day Relative Strength Index at 53 has eased from near overbought, indicating that momentum has cooled while remaining above the midline. RSI holds above 50, keeping a modest bullish bias.

Gold on fire at the start of the week on US-Venezuela tensions

Gold regains upside traction early Monday as flight to safety prevails on Venezuela turmoil. The US Dollar finds strong haven demand, caps Gold’s upside as focus shifts to US jobs data. Gold’s daily technical setup suggests that more upside remains in the offing.

Bulls firmly in control as Bitcoin breaks $93K, Ethereum and Ripple extend gains

Bitcoin, Ethereum, and Ripple extended their rallies on Monday, gaining more than 4%, 6%, and 12%, respectively, in the previous week. The top three cryptocurrencies by market capitalization could continue to outperform, with bulls in control of the momentum.

Economic outlook 2026-2027 in advanced countries: Solidity test

After a year marked by global economic resilience and ending on a note of optimism, 2026 looks promising and could be a year of solid economic performance. In our baseline scenario, we expect most of the supportive factors at work in 2025 to continue to play a role in 2026.

Meme Coins Price Prediction: Dogecoin, Shiba Inu, Pepe rally on Venezuela’s shadow BTC reserve

Meme coins such as Dogecoin, Shiba Inu, and Pepe are leading the cryptocurrency market rally driven by the US cross-border operation to capture Venezuelan President Nicolás Maduro. Dogecoin extends its gain for the fifth consecutive day while SHIB and PEPE take a pause.