GBP/USD Price Analysis: Further downside hinges on 1.2135 break and UK Budget


  • GBP/USD remains pressured after reversing from one-month high.
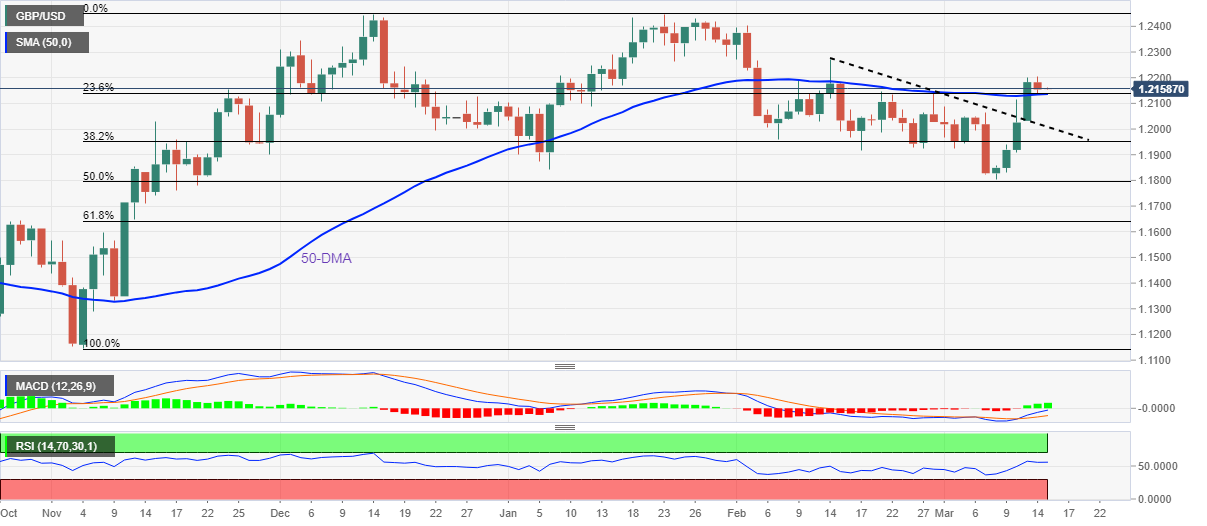
  • Convergence of 50-DMA, 23.6% Fibonacci retracement limits immediate downside.
  • Bullish MACD signals, upbeat RSI (14) keeps buyers hopeful.
  • UK Chancellor Hunt will deliver Budget speech in Parliament at 12:30 GMT.

GBP/USD bears struggle to keep the reins, after entering the ring the previous day, as the quote stays depressed around 1.2160 during early Wednesday. In doing so, the Cable pair grinds near the short-term key support confluence as traders await the UK Finance Minister (Chancellor) Jeremy Hunt’s annual budget speech.

Also read: UK Chancellor Hunt, hemmed in by debt, set to focus on growth in British budget

Apart from the convergence of the 50-DMA and 23.6% Fibonacci retracement level of the GBP/USD pair’s upside from November 2022 to February 2023, around 1.2135, the bullish MACD signals and upbeat RSI (14), not overbought, also favor the Cable pair buyers.

Even if the quote breaks the 1.2135 support confluence, the resistance-turned-support line from mid-February, around 1.2005 at the latest, adds to the downside filters.

It’s worth noting that the GBP/USD bears need validation from the 50% Fibonacci retracement level surrounding 1.1800 to retake control. That said, lows marked during January and in the last week, respectively near 1.1840 and 1.1805, act as additional supports to watch during the quote’s further downside.

On the flip side, February’s top surrounding 1.2270 precedes the 1.2300 and 1.2350 round figures to test the GBP/USD bulls before directing them to the yearly top, marked in February around 1.2450.

Overall, GBP/USD remains on the bull’s radar even if the pair snapped a four-day uptrend, as well as reversed from a one-month high, the previous day.

GBP/USD: Daily chart

Trend: Upside expected

Additional important levels

Overview
Today last price 1.2156
Today Daily Change -0.0027
Today Daily Change % -0.22%
Today daily open 1.2183
 
Trends
Daily SMA20 1.2016
Daily SMA50 1.2131
Daily SMA100 1.2026
Daily SMA200 1.1899
 
Levels
Previous Daily High 1.22
Previous Daily Low 1.2032
Previous Weekly High 1.2114
Previous Weekly Low 1.1803
Previous Monthly High 1.2402
Previous Monthly Low 1.1915
Daily Fibonacci 38.2% 1.2136
Daily Fibonacci 61.8% 1.2096
Daily Pivot Point S1 1.2077
Daily Pivot Point S2 1.197
Daily Pivot Point S3 1.1909
Daily Pivot Point R1 1.2244
Daily Pivot Point R2 1.2306
Daily Pivot Point R3 1.2412


Share: Feed news

Information on these pages contains forward-looking statements that involve risks and uncertainties. Markets and instruments profiled on this page are for informational purposes only and should not in any way come across as a recommendation to buy or sell in these assets. You should do your own thorough research before making any investment decisions. FXStreet does not in any way guarantee that this information is free from mistakes, errors, or material misstatements. It also does not guarantee that this information is of a timely nature. Investing in Open Markets involves a great deal of risk, including the loss of all or a portion of your investment, as well as emotional distress. All risks, losses and costs associated with investing, including total loss of principal, are your responsibility. The views and opinions expressed in this article are those of the authors and do not necessarily reflect the official policy or position of FXStreet nor its advertisers. The author will not be held responsible for information that is found at the end of links posted on this page.

If not otherwise explicitly mentioned in the body of the article, at the time of writing, the author has no position in any stock mentioned in this article and no business relationship with any company mentioned. The author has not received compensation for writing this article, other than from FXStreet.

FXStreet and the author do not provide personalized recommendations. The author makes no representations as to the accuracy, completeness, or suitability of this information. FXStreet and the author will not be liable for any errors, omissions or any losses, injuries or damages arising from this information and its display or use. Errors and omissions excepted.

The author and FXStreet are not registered investment advisors and nothing in this article is intended to be investment advice.

Recommended content


Recommended content

Editors’ Picks

AUD/USD falls amid highs US yields, Fed’s tough stance

AUD/USD falls amid highs US yields, Fed’s tough stance

The Australian Dollar posted losses of 0.23% against the US Dollar on Thursday amid higher US yields that underpinned the Greenback during the day. Wall Street hit new all-time highs but retreated afterward, ending the session with losses. 

AUD/USD News

EUR/USD slipped on Thursday after Greenback pares some losses

EUR/USD slipped on Thursday after Greenback pares some losses

EUR/USD eased slightly on Thursday, falling back below 1.0880 as the Greenback broadly recovers losses from earlier in the week. The pair remains up for the trading week, but a late break for the US Dollar is on the cards as investors second-guess the Fed's stance on rate cuts.

EUR/USD News

Gold loses its bright and tumbles on firm US Dollar, Fed hawkish comments

Gold loses its bright and tumbles on firm US Dollar, Fed hawkish comments

Gold prices fell in the mid-North American session on Thursday, below $2,390, as US Treasury yields recovered and underpinned the Greenback. Wednesday’s inflation report in the United States sponsored the golden metal rally, but Thursday’s data was a mixed bag, which could likely trigger some profit-taking ahead of the weekend.

Gold News

LINK price jumps 10% as Chainlink races toward tokenization of funds

LINK price jumps 10% as Chainlink races toward tokenization of funds

Chainlink price has remained range-bound for a while, stuck between the $16.00 roadblock to the upside and $13.08 to the downside. However, in light of recent revelations, the token may have further upside potential.

Read more

April CPI: Worst good news ever

April CPI: Worst good news ever

The monthly rise in prices based on the Consumer Price Index (CPI) came in slightly lower than projected, sending a wave of euphoria across the financial landscape. The consensus is cooling inflation puts Federal Reserve interest rate cuts back on the table.

Read more

Forex MAJORS

Cryptocurrencies

Signatures