GBP/USD Price Analysis: Falls below 100-day SMA to battle 1.2500
- GBP/USD prints three-day losing streak while testing 23.6% Fibonacci retracement.
- MACD flirts with the bears, joins downside break of the key SMA to suggest further weakness in prices.
- An ascending trend line from March 20 becomes important support.

GBP/USD drops to 1.2502 amid the initial trading hours of Monday’s Asian session. In doing so, the Cable pair slips below 100-day SMA. Other than the pair’s downside break of the key SMA, MACD histogram also favors the sellers.
As a result, the quote is likely to revisit an ascending trend line from May 20, at 1.2413 now. However, the pair’s further downside will be decisive.
Should the GBP/USD prices manage to portray a daily closing below 1.2413, May 26 top surrounding 1.2360 could lure the bears. Additionally, the sellers’ dominance past-1.2360 might not refrain from challenging the previous month's bottom surrounding 1.2200.
Meanwhile, the pair’s upside break beyond 100-day SMA level of 1.2530 could aim for April month high near 1.2645 whereas 1.2700 might add filters during the pair’s additional rise.
It should, however, be noted that a daily close beyond the monthly top of 1.2813 will push the pair further towards 1.3000 threshold.
GBP/USD daily chart
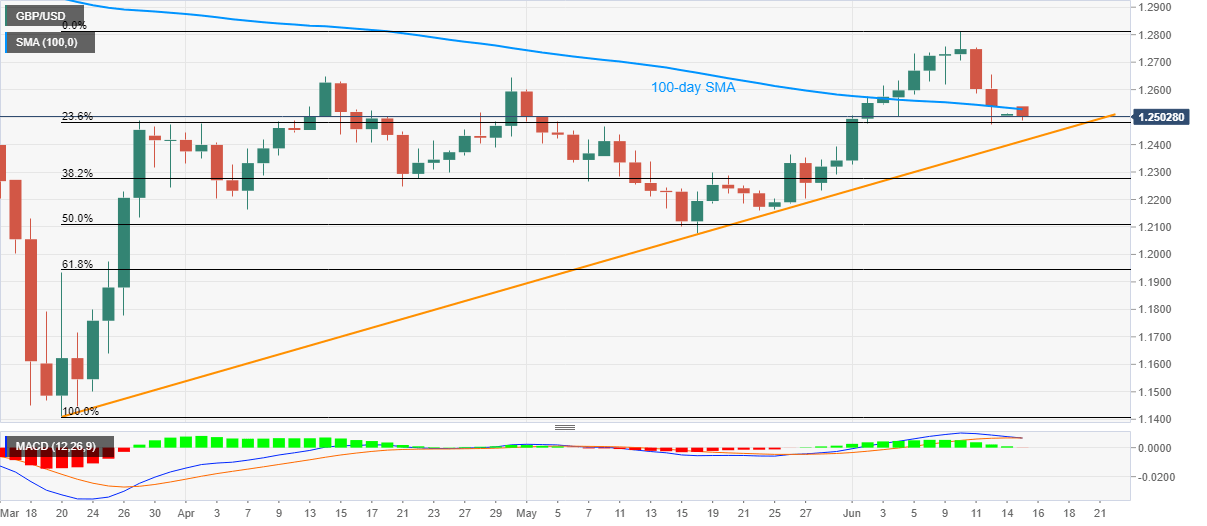
Trend: Bearish
Author

Anil Panchal
FXStreet
Anil Panchal has nearly 15 years of experience in tracking financial markets. With a keen interest in macroeconomics, Anil aptly tracks global news/updates and stays well-informed about the global financial moves and their implications.


