GBP/USD Price Analysis: Eyes to regain 1.3600 inside weekly rising triangle


  • GBP/USD reverses the previous day’s pullback from two-month top.
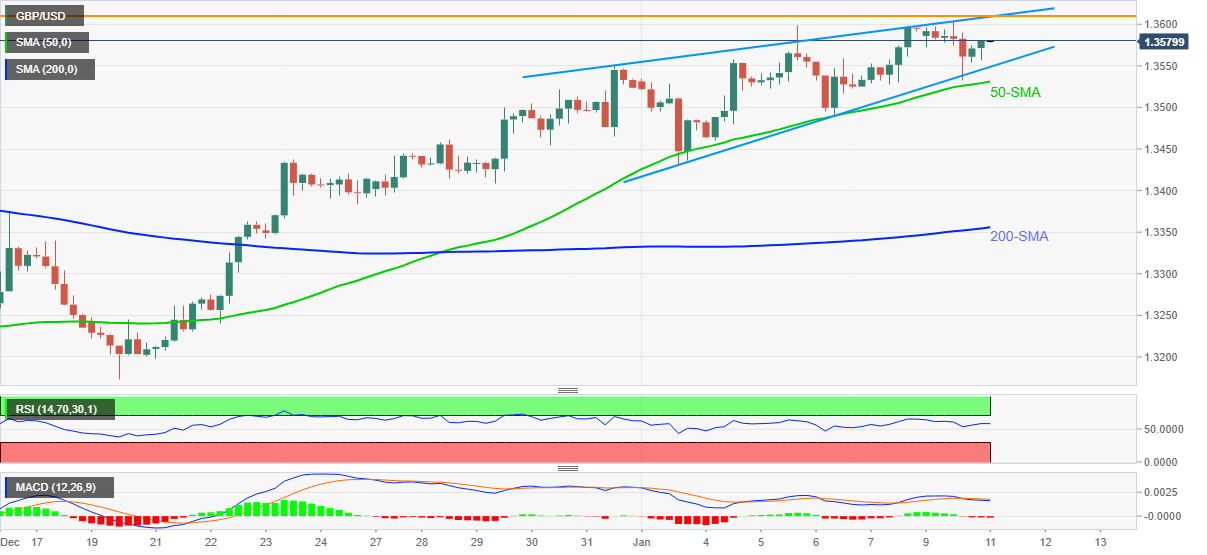
  • Bulls seem to have exhausted beyond 50-SMA, MACD hints at pullback.
  • Horizontal resistance line from November joins triangle’s upper line to test bulls.

GBP/USD pares the previous day’s losses around 1.3580 amid Tuesday’s Asian session.

In doing so, the cable pair picks up bids inside short-term ascending triangle formation. However, steady RSI and sluggish MACD joins the pair’s failures to stay beyond 1.3600 keep sellers hopeful.

While the current advances eye 1.3600 threshold, the upper line of the stated triangle from December 31 and a horizontal line comprising multiple levels marked since November, highlight the 1.3610 level as the key hurdle.

Should the quote rises past 1.3610, which becomes less likely, a run-up towards November’s high near 1.3700 can’t be ruled out.

On the flip side, pullback moves may initially aim for the triangle’s lower line near 1.3550. Though, bears remain unconvinced beyond the 50-SMA level of 1.3530. Also acting as a downside filter is the latest December’s swing low near 1.3480 and the 200-SMA level of 1.3355.

Overall, GBP/USD pair’s inability to stay firmer around multi-day top teases sellers.

GBP/USD: Four-hour chart

Trend: Pullback expected

Additional important levels

Overview
Today last price 1.358
Today Daily Change 0.0001
Today Daily Change % 0.01%
Today daily open 1.3579
 
Trends
Daily SMA20 1.3418
Daily SMA50 1.3397
Daily SMA100 1.3555
Daily SMA200 1.3739
 
Levels
Previous Daily High 1.3604
Previous Daily Low 1.3532
Previous Weekly High 1.3599
Previous Weekly Low 1.3431
Previous Monthly High 1.355
Previous Monthly Low 1.3161
Daily Fibonacci 38.2% 1.356
Daily Fibonacci 61.8% 1.3577
Daily Pivot Point S1 1.354
Daily Pivot Point S2 1.35
Daily Pivot Point S3 1.3468
Daily Pivot Point R1 1.3611
Daily Pivot Point R2 1.3643
Daily Pivot Point R3 1.3682


Share: Feed news

Information on these pages contains forward-looking statements that involve risks and uncertainties. Markets and instruments profiled on this page are for informational purposes only and should not in any way come across as a recommendation to buy or sell in these assets. You should do your own thorough research before making any investment decisions. FXStreet does not in any way guarantee that this information is free from mistakes, errors, or material misstatements. It also does not guarantee that this information is of a timely nature. Investing in Open Markets involves a great deal of risk, including the loss of all or a portion of your investment, as well as emotional distress. All risks, losses and costs associated with investing, including total loss of principal, are your responsibility. The views and opinions expressed in this article are those of the authors and do not necessarily reflect the official policy or position of FXStreet nor its advertisers. The author will not be held responsible for information that is found at the end of links posted on this page.

If not otherwise explicitly mentioned in the body of the article, at the time of writing, the author has no position in any stock mentioned in this article and no business relationship with any company mentioned. The author has not received compensation for writing this article, other than from FXStreet.

FXStreet and the author do not provide personalized recommendations. The author makes no representations as to the accuracy, completeness, or suitability of this information. FXStreet and the author will not be liable for any errors, omissions or any losses, injuries or damages arising from this information and its display or use. Errors and omissions excepted.

The author and FXStreet are not registered investment advisors and nothing in this article is intended to be investment advice.

Recommended content


Recommended content

Editors’ Picks

AUD/USD failed just ahead of the 200-day SMA

AUD/USD failed just ahead of the 200-day SMA

Finally, AUD/USD managed to break above the 0.6500 barrier on Wednesday, extending the weekly recovery, although its advance faltered just ahead of the 0.6530 region, where the key 200-day SMA sits.

AUD/USD News

EUR/USD met some decent resistance above 1.0700

EUR/USD met some decent resistance above 1.0700

EUR/USD remained unable to gather extra upside traction and surpass the 1.0700 hurdle in a convincing fashion on Wednesday, instead giving away part of the weekly gains against the backdrop of a decent bounce in the Dollar.

EUR/USD News

Gold keeps consolidating ahead of US first-tier figures

Gold keeps consolidating ahead of US first-tier figures

Gold finds it difficult to stage a rebound midweek following Monday's sharp decline but manages to hold above $2,300. The benchmark 10-year US Treasury bond yield stays in the green above 4.6% after US data, not allowing the pair to turn north.

Gold News

Bitcoin price could be primed for correction as bearish activity grows near $66K area

Bitcoin price could be primed for correction as bearish activity grows near $66K area

Bitcoin (BTC) price managed to maintain a northbound trajectory after the April 20 halving, despite bold assertions by analysts that the event would be a “sell the news” situation. However, after four days of strength, the tables could be turning as a dark cloud now hovers above BTC price.

Read more

Bank of Japan's predicament: The BOJ is trapped

Bank of Japan's predicament: The BOJ is trapped

In this special edition of TradeGATEHub Live Trading, we're joined by guest speaker Tavi @TaviCosta, who shares his insights on the Bank of Japan's current predicament, stating, 'The BOJ is Trapped.' 

Read more

Forex MAJORS

Cryptocurrencies

Signatures