|

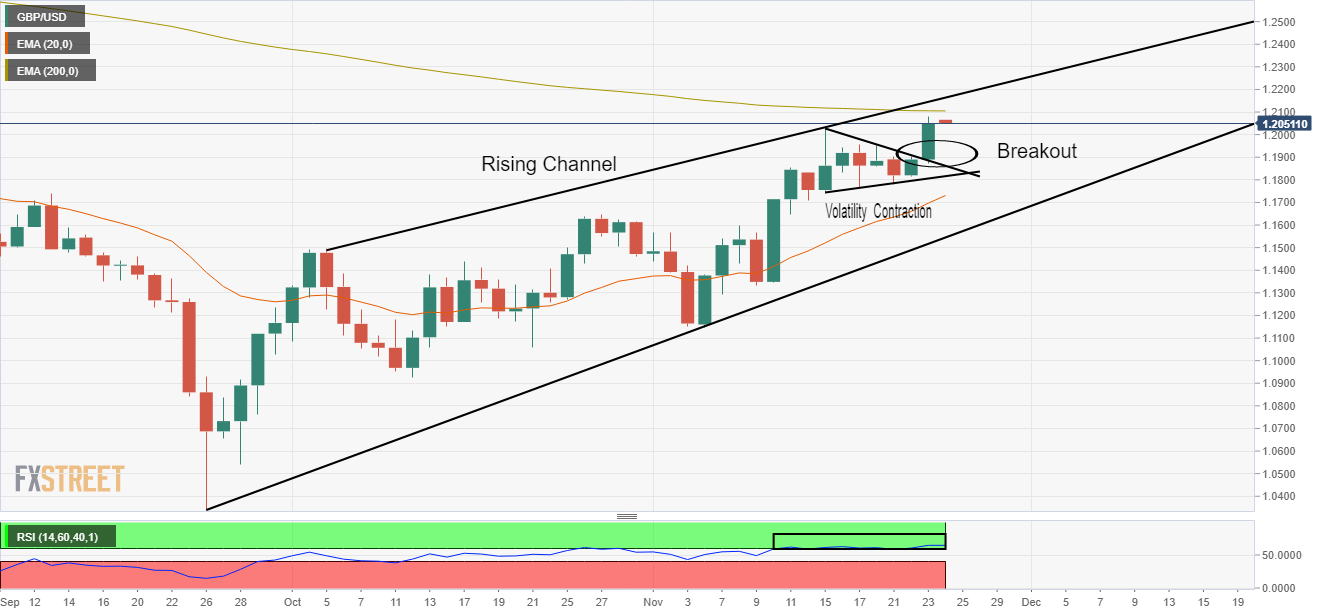
GBP/USD Price Analysis: Establishment above 1.2000 is a prerequisite for further upside

  • Upbeat market sentiment has strengthened the Pound Sterling.
  • A breakout of a VCP results in wider ticks formation and heavy volume.
  • The formation of a Rising Channel indicates that the broader trend is towards the north.

The GBP/USD pair is displaying a sideways performance in the early Tokyo session after a juggernaut rally to near 1.2080. The Cable witnessed an immense buying interest after sustaining above the round-level resistance of 1.1900. A significant improvement in investors’ risk appetite strengthened the Pound Sterling.

Meanwhile, the US dollar index (DXY) has dropped 106.00 despite a firmer jump in the US Durable Goods Order data. It seems that less-hawkish cues on interest rate guidance from the Federal Open Market Committee (Fed) minutes have impacted the US Dollar. Investors should know that US markets are closed today on account of Thanksgiving Day.

On a daily scale, the Cable has delivered a breakout of a Volatility Contraction Pattern (VCP) that results in the formation of wider ticks and heavy volume. Broadly, a Rising Channel formation satisfies the condition of a long-term upside trend. Also, advancing the 20-period Exponential Moving Average (EMA) at 1.1738 adds to the upside filters.

Adding to that, the Relative Strength Index (RSI) (14) has shifted into the bullish range of 60.00-80.00, which indicates that the upside momentum is active.

Going forward, the mighty 200-period EMA at 1.2110 could be a hurdle for the Pound Sterling bulls.

For further upside, the asset is required to establish firmly above the psychological resistance of 1.2000. But for a run-up, the Cable is needed to overstep the 200-EMA at 1.2110 firmly, which will drive GBP/USD towards the round-level resistance of 1.2200, followed by August 2 high at 1.2280.

On the flip side, a drop below Monday’s low at 1.1780 will drag the asset toward November 14 low at 1.1710. A slippage below November 14 low will expose the asset to the horizontal support plotted from October 27 high at 1.1646.

GBP/USD daily chart

GBP/USD

Overview
Today last price1.2051
Today Daily Change0.0161
Today Daily Change %1.35
Today daily open1.189
 
Trends
Daily SMA201.1632
Daily SMA501.138
Daily SMA1001.1641
Daily SMA2001.2207
 
Levels
Previous Daily High1.1903
Previous Daily Low1.1814
Previous Weekly High1.2029
Previous Weekly Low1.171
Previous Monthly High1.1646
Previous Monthly Low1.0924
Daily Fibonacci 38.2%1.1869
Daily Fibonacci 61.8%1.1848
Daily Pivot Point S11.1835
Daily Pivot Point S21.178
Daily Pivot Point S31.1746
Daily Pivot Point R11.1924
Daily Pivot Point R21.1958
Daily Pivot Point R31.2013

Author

Sagar Dua

Sagar Dua

FXStreet

Sagar Dua is associated with the financial markets from his college days. Along with pursuing post-graduation in Commerce in 2014, he started his markets training with chart analysis.

More from Sagar Dua
Share:

Editor's Picks

GBP/USD loses momentum, flirts with 1.3200

GBP/USD is struggling to maintain its positive bias on Thursday, retreating toward the 1.3200 region in response to the pick in the buying interest around the Greenback. That said, Cable remains under scrutiny as cautious market sentiment keeps investors focused on the US-Iran conflict and political effervescence in the UK.

EUR/USD trims gains, challenges 1.1400

EUR/USD now gives away part of its earlier advance, receding toward the 1.1400 contention zone on Thursday. Meanwhile, the pair’s recovery comes amid extra losses in the US Dollar, at the time when while investors continue to monitor developments in the Middle East and sentiment surrounding global technology stocks.

Gold remains bid and close to $4,100

Gold accelerates its recovery and approaches the key $4,000 mark per troy ounce at the end of the week, adding to Thursday’s advance. However, expectations for a hawkish Fed remain steady and keep the yellow metal’s potential upside contained.

Crypto Today: Bitcoin at $60,000, Ethereum at $1,500, and XRP at $1 face a make-or-break test

Bitcoin (BTC), Ethereum (ETH), and Ripple (XRP) are trading in the red on Friday after three consecutive days of losses, testing their respective make-or-break support levels.

Week ahead – NFP report to challenge Dollar strength and the hawkish Fed

Dollar strength dominates markets, as the hawkish Fed overshadows geopolitics and lower oil prices. NFP week could drive September Fed hike expectations and boost market volatility. The euro lacks fresh bullish catalysts, all eyes on the preliminary inflation report and the ECB Forum.

Regime change: Inside Kevin Warsh's first move to make the Fed unreadable on purpose

The rate did not move. That was the least interesting thing about Kevin Warsh's first meeting in charge of the Fed. The FOMC held its benchmark at 3.50%-3.75% for the fourth straight meeting, exactly as priced, and then the new chair used his first press conference to dismantle the machinery the market has leaned on for a decade.