GBP/USD Price Analysis: Consolidates below one-month-old descending trend-line resistance
- GBP/USD remains confined in a narrow trading range during the Asian session on Friday.
- Traders wait for the release of the US PCE Price Index before placing fresh directional bets.
- A breakthrough a descending trend-line is needed to support prospects for additional gains.

The GBP/USD pair struggles to gain any meaningful traction on Friday and oscillates in a narrow trading band, just above the 1.2700 mark during the Asian session. Spot prices, meanwhile, remain well within the striking distance of a nearly two-week high touched on Wednesday and now look to the release of the US PCE Price Index for a fresh impetus.
The crucial US inflation data will play a key role in influencing expectations about the timing of when the Federal Reserve (Fed) will start cutting interest rates, which, in turn, will drive the US Dollar (USD). In the meantime, the stronger-than-expected US economic growth figures, along with signs of easing inflationary pressures, raise the prospects for a soft landing. This leads to a further decline in the US Treasury bond yields, which keeps the USD bulls on the defensive and lends some support to the GBP/USD pair.
Meanwhile, a strong start to the year by the UK economy gives the Bank of England (BoE) a reason to hold interest rates at the highest level in nearly 16 years when it meets next week. This might continue to underpin the British Pound (GBP) and support prospects for a further near-term appreciating move for the GBP/USD pair. That said, diminishing odds for an early interest rate cut by the Fed might hold back traders from placing aggressive USD bearish bets and cap gains for the pair ahead of the FOMC meeting next week.
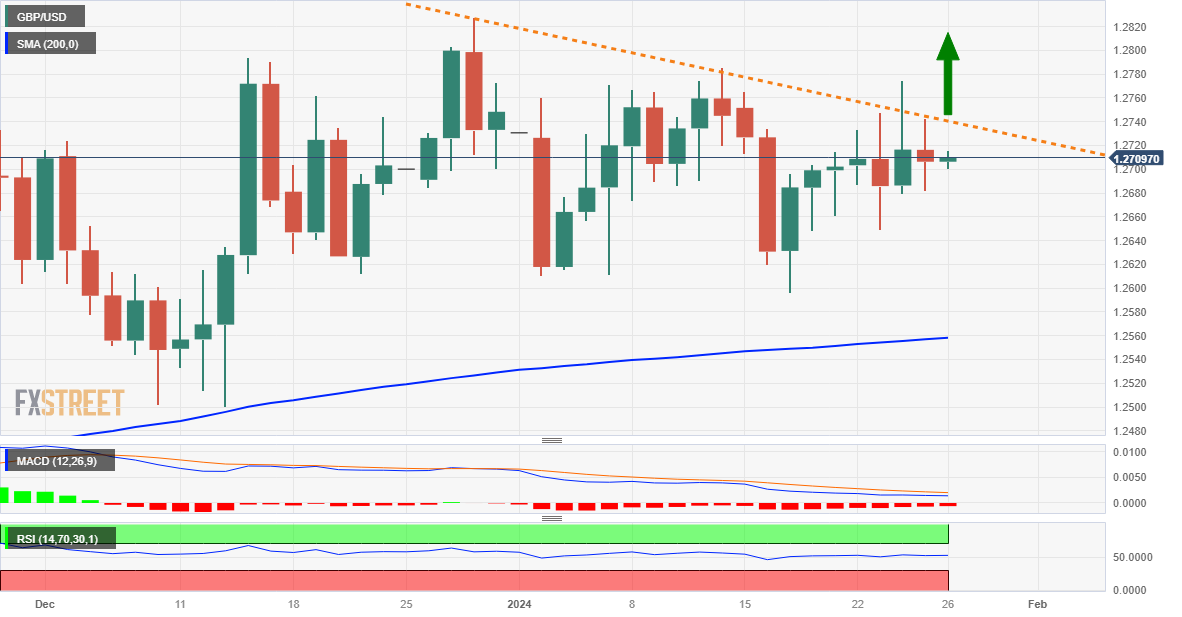
From a technical perspective, the GBP/USD pair, so far, has been struggling to make it through a downward sloping trend-line extending from the December swing high. The said barrier is currently pegged near the 1.2740 region, which if cleared decisively should pave the way for additional gains. Spot prices might then accelerate the momentum toward reclaiming the 1.2800 round figure and climb further towards the 1.2825-1.2830 zone, or the highest level since August 2023 touched last month.
On the flip side, the 1.2680 region, followed by the 1.2655-1.2650 area could offer immediate support, below which the GBP/USD pair could slide back to test sub-1.2600 levels or the monthly trough. Some follow-through selling might shift the near-term bias in favour of bearish trades and expose the very important 200-day SMA, currently near the 1.2555 region before spot prices eventually drop to the 1.2500 psychological mark.
GBP/USD daily chart
Technical levels to watch
Author

Haresh Menghani
FXStreet
Haresh Menghani is a detail-oriented professional with 10+ years of extensive experience in analysing the global financial markets.


