|

GBP/USD Price Analysis: Cable justifies downbeat UK retail spending to reverse from 50-SMA to 1.2750

  • GBP/USD prints the first daily loss in three, holds lower grounds of late.
  • UK BRC Retail Sales suggest the lowest public spending in 11 months.
  • 50-SMA precedes 1.2825-30 resistance confluence to test Pound Sterling buyers.
  • Upbeat oscillators suggest limited downside room despite presence of three-week-old bearish channel.

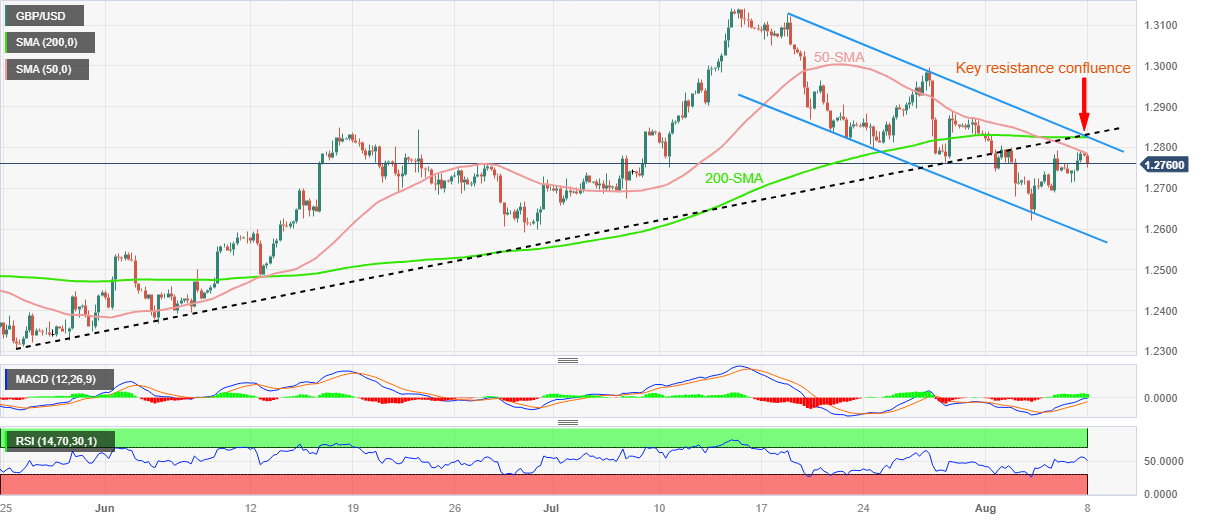
GBP/USD takes offers to refresh the intraday low near 1.2755, posting the first daily loss in three amid early Tuesday in Europe. In doing so, the Cable pair justifies downbeat UK data while reversing from the 50-SMA within a three-week-old bearish channel.

The latest survey from the British Retail Consortium (BRC) marked the weakest Retail Sales growth in 15 months as it prints the 1.8% YoY figure for July versus 4.2% prior. Following the data release, the BRC said, per Reuters, that the British retailers suffered from heavy rain in July on top of the impact of high inflation with sales growth dropping to an 11-month low.

Technically, the Pound Sterling reverses from the 50-SMA hurdle of around 1.2785 as the RSI (14) line retreats. However, the oscillators remain beyond the 50 level suggesting the upbeat momentum and keeping the GBP/USD buyers hopeful amid the bullish MACD signals.

With this, the quote is likely to cross the immediate upside hurdle surrounding 1.2785 with the aim for reclaim the 1.2800 round figure.

However, a convergence of the 200-SMA, the previous support line from May 25 and a top line of the aforementioned descending trend channel highlights the 1.2825-30 as a tough nut to crack for the GBP/USD bulls.

Meanwhile, the 1.2700 round figure and the latest low of 1.2620 can entertain GBP/USD sellers ahead of challenging them with the bottom line of the stated channel, close to 1.2585. It’s worth mentioning that June’s low of 1.2590 can also challenge the Cable bears around 1.2585–90 zone.

GBP/USD: Daily chart
Trend: Limited downside expected

Additional important levels

Overview
Today last price1.2757
Today Daily Change-0.0027
Today Daily Change %-0.21%
Today daily open1.2784
 
Trends
Daily SMA201.289
Daily SMA501.2744
Daily SMA1001.2591
Daily SMA2001.2324
 
Levels
Previous Daily High1.2789
Previous Daily Low1.2713
Previous Weekly High1.2873
Previous Weekly Low1.2621
Previous Monthly High1.3142
Previous Monthly Low1.2659
Daily Fibonacci 38.2%1.276
Daily Fibonacci 61.8%1.2742
Daily Pivot Point S11.2735
Daily Pivot Point S21.2686
Daily Pivot Point S31.2658
Daily Pivot Point R11.2811
Daily Pivot Point R21.2839
Daily Pivot Point R31.2888

Author

Anil Panchal

Anil Panchal

FXStreet

Anil Panchal has nearly 15 years of experience in tracking financial markets. With a keen interest in macroeconomics, Anil aptly tracks global news/updates and stays well-informed about the global financial moves and their implications.


More from Anil Panchal
Share:

Editor's Picks

AUD/USD remains below 0.7000 amid light trading

AUD/USD fills a modest bearish gap on Monday, but remains below 0.7000 in the Asian session amid holiday-thinned liquidity. The US Dollar attempts a bounce even as US bond yields pull back from multi-year highs, limiting the pair. Moreover, diminishing odds of another RBA rate hike in November cap the Aussie.

USD/JPY hovers above 158.00 amid Japan/ US holiday

USD/JPY extends its range-bound price action into a new week, trading above 158.00 as bulls remain on high alert amid speculation that authorities will step in to prop up the Japanese Yen. Meanwhile, softer US bond yields keep US Dollar bulls on the back foot and cap the pair's upside. However, geopolitical uncertainties could limit losses for the safe-haven buck amid thin liquidity due to a holiday in Japan and the US.

Gold  remains vulnerable below $4,200 on Fed hike bets

Gold is under mild selling pressure on Monday, trading at around $4,170. The US Dollar advances modestly in thin trading, supported by bets that the Federal Reserve will hike rates at least one more time before year-end.

Bitcoin struggles as ETF outflows, geopolitical uncertainty weigh

Bitcoin hovers around $83,600 on Monday after a 3.1% correction last week. US-listed spot ETFs recorded an outflow of $681.10 million last week, snapping the three-week inflow streak. Geopolitical uncertainty and mixed signals keep investors cautious.

The week ahead: A critical week as earnings and CPI test market

The Oil price is relatively stable this morning, and US and European stock markets are poised to open higher, as risk sentiment shrugs off an escalation in the Middle East and concerns about rising bond yields.

Has Bitcoin really escaped the macro forces it was built to fight?
Over 17 years ago, Satoshi Nakamoto designed Bitcoin (BTC) on the back of a global financial crisis as an alternative to the global monetary system outside the control of central banks, governments and traditional intermediaries. This raises a key question: has Bitcoin really become independent of the macroeconomic forces it was built to challenge?














