GBP/USD Price Analysis: Bulls seeking break from bullish reverse H&S
- GBP/USD is in the hands of the bulls as the weekly and monthly charts align.
- The daily chart, however, shows that there is still some work to do from the bulls.
Cable was all over the place on Thursday in response to a softer dollar and the Bank of England.
Nevertheless, the bulls are in control from a longer-term perspective.
The following is a top-down analysis that illustrates the bullish confirmation bias across the weekly and monthly chart with some work still to do from the bulls on a daily time frame analysis.
Weekly chart
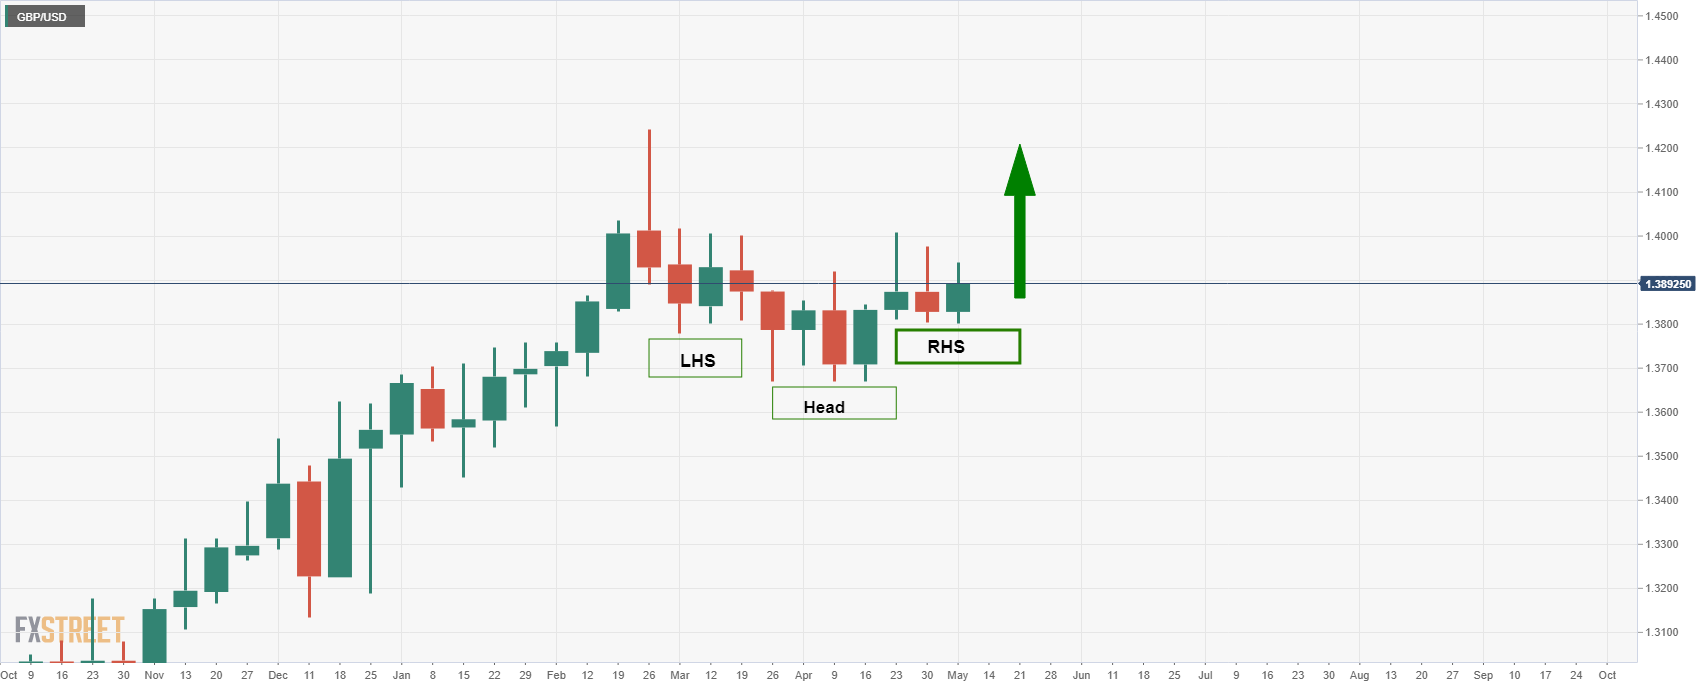
The reverse head and shoulders patterns are a bullish arrangement that would be expected to result in a fresh weekly bullish impulse for a new cycle high.
However, there is some work left to do for the bulls yet from a lower time frame perspective as follows:
Daily chart
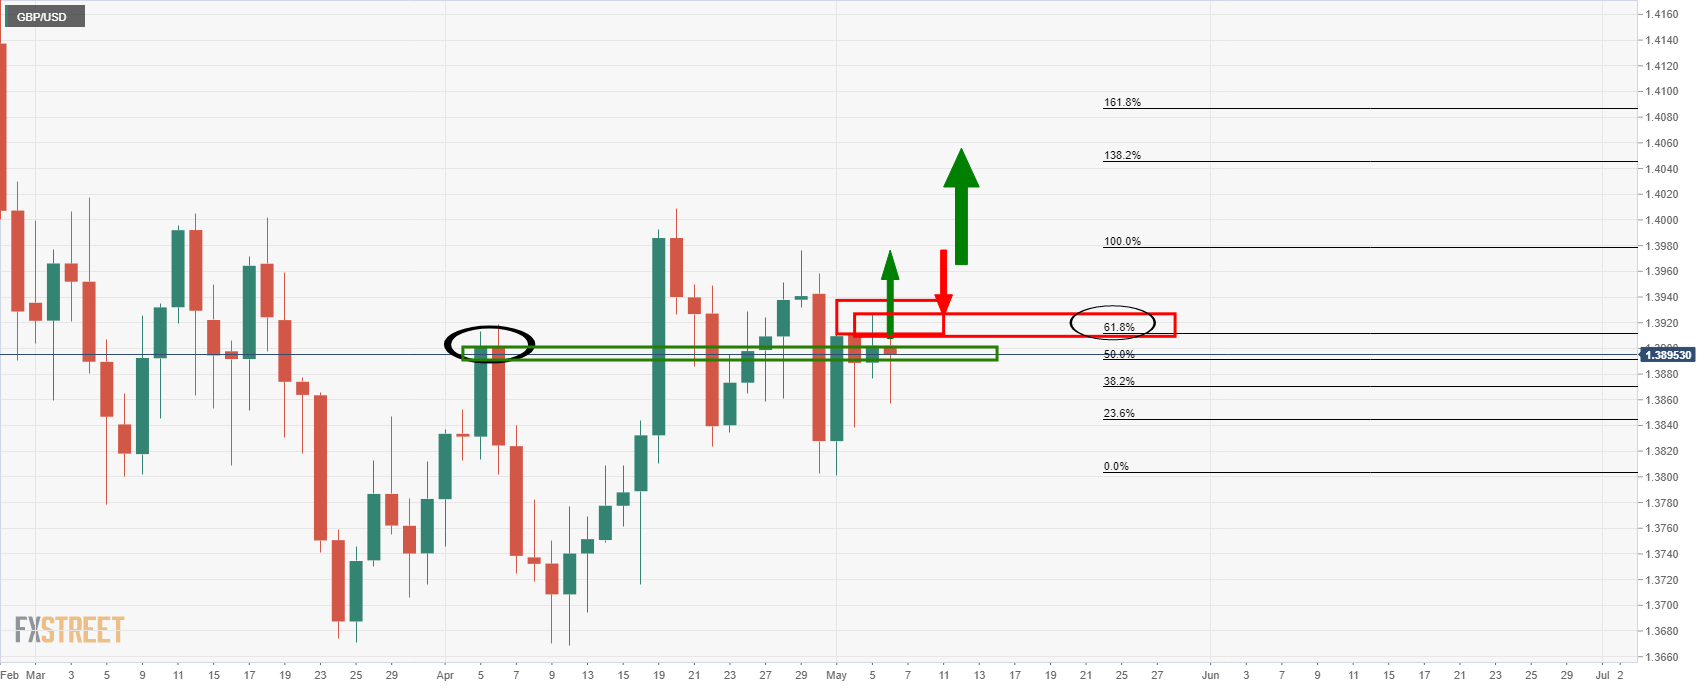
The bulls will want to see a break of the daily resistance and clear the 61.8% Fibonacci retracement of the prior bearish impulse with conviction prior to diving in.
With that being said, the bulls will be encouraged by the monthly chart's conditions which align with the bullish bias.
Monthly chart
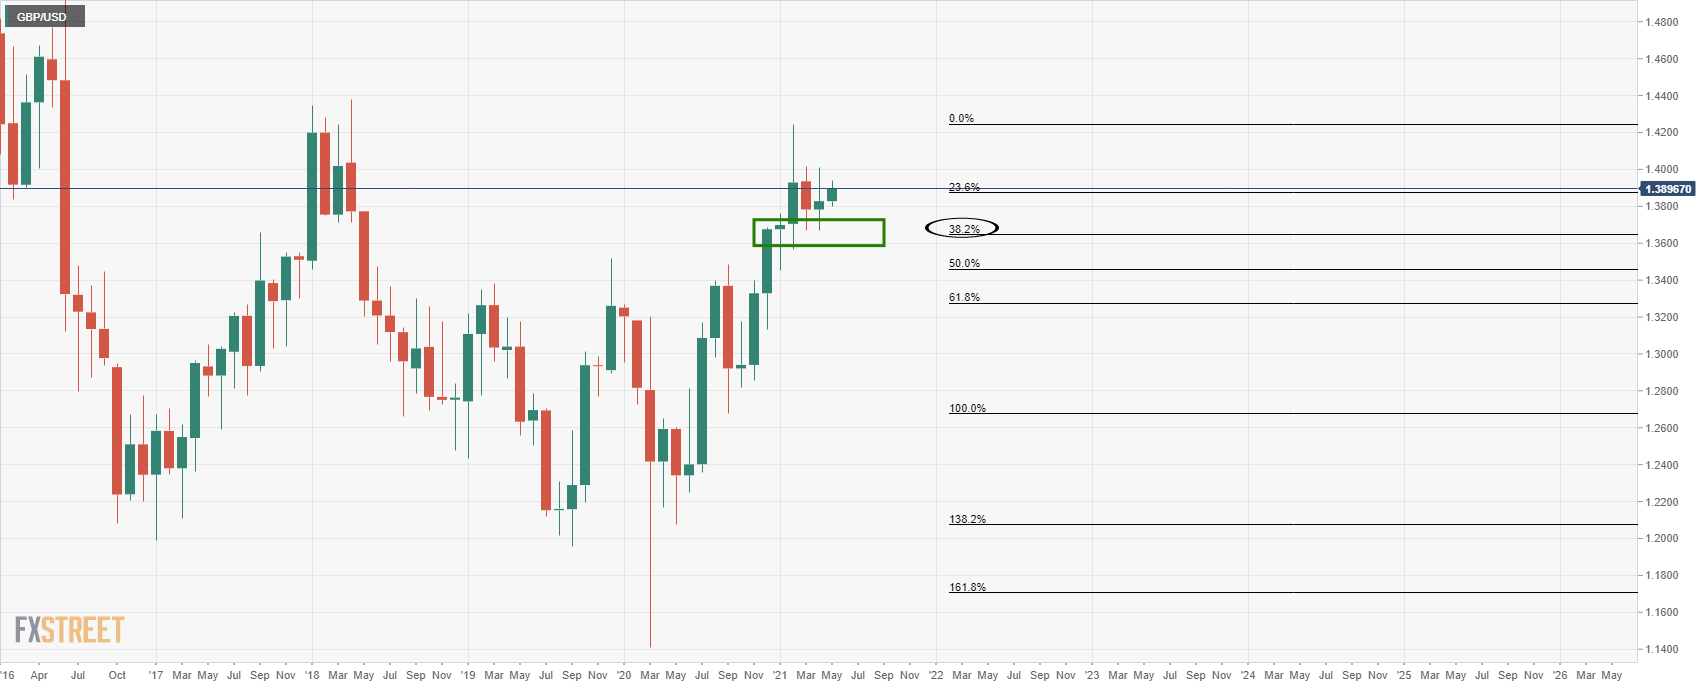
Bulls would expect an upside continuation considering the solid support structure and prior test of the 38.2% Fibonacci retracement.
Author

Ross J Burland
FXStreet
Ross J Burland, born in England, UK, is a sportsman at heart. He played Rugby and Judo for his county, Kent and the South East of England Rugby team.


