GBP/USD Price Analysis: Bulls await a move beyond 1.3850 confluence hurdle
- GBP/USD gained traction for the second straight day and recovered further from two-and-half-month lows.
- The momentum confirmed a near-term bullish breakout through a one-and-half-week-old descending channel.
- Mixed technical indicators on hourly/daily charts warrant some caution before placing aggressive bullish bets.
The GBP/USD pair built on the post-NFP goodish recovery move from two-and-half-month lows and gained some follow-through traction for the second consecutive session on Monday. The momentum pushed the pair to three-day tops, around mid-1.3800s during the mid-European session.
Investors scaled back their expectations for an earlier than anticipated policy tightening by the Fed following an unexpected rise in the US unemployment rate. This, in turn, kept the US dollar bulls on the defensive and was seen as a key factor that pushed the GBP/USD pair higher.
On the other hand, expectations that the UK Prime Minister Boris Johnson is preparing to lift most restrictions in England on July 19 acted as a tailwind for the British pound. This provided an additional boost to the GBP/USD pair and remained supportive of the ongoing move up.
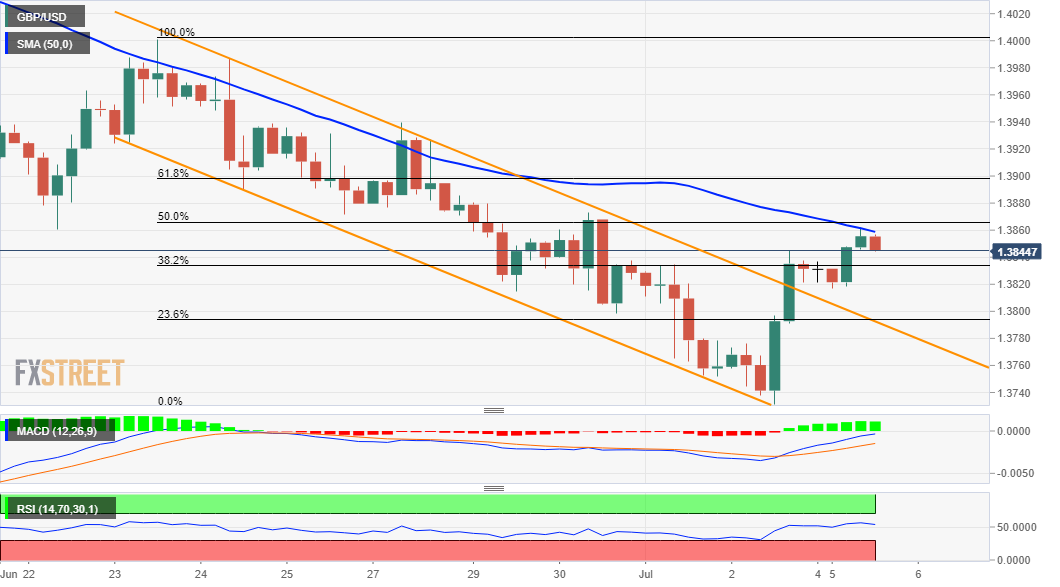
From a technical perspective, the GBP/USD pair confirmed a bullish breakout through a resistance marked by the top end of a one-and-half-week-old descending trend channel. Bulls now await a sustained move beyond the 1.3850 confluence region before positioning for any further gains.
The mentioned region comprises the 50% Fibonacci level of the 1.4000-1.3732 downfall and 50-period SMA on the 4-hourly chart. This should now act as a key pivotal point for traders and help determine the near-term trajectory for the GBP/USD pair amid absent fundamental triggers.
Meanwhile, technical indicators on hourly charts have been gaining positive traction but are yet to recover from the bearish territory. Hence, a sustained move beyond the 1.3850 region is needed to confirm that the GBP/USD pair might have bottomed out near the 1.3730 area.
The next relevant resistance is pegged near the 23.6% Fibo. level, around the 1.3900 mark. This is followed by the 1.3925-30 supply zone, above which the GBP/USD pair seems all set to build on the momentum and aim back to reclaim the key 1.4000 psychological mark.
On the flip side, the 38.2% Fibo. level, around the 1.3835 region, now seems to protect the immediate downside ahead of the daily swing lows, around the 1.3815 area. Any subsequent fall might be seen as a buying opportunity and remain limited near the trend-channel resistance breakpoint.
A convincing break below the latter, currently around the 1.3800-1.3795 region, will negate prospects for any further gains and turn the GBP/USD pair vulnerable. The next relevant support is pegged near the 1.3730 region, or monthly lows touched on Friday ahead of the 1.3700 mark.
GBP/USD 4-hour chart
Technical levels to watch
Author

Haresh Menghani
FXStreet
Haresh Menghani is a detail-oriented professional with 10+ years of extensive experience in analysing the global financial markets.


