GBP/USD Price Analysis: Battles 1.3600 inside monthly rising wedge on 4H


  • GBP/USD takes a U-turn from intraday top, struggles to stay beyond 100-bar SMA.
  • Bearish chart pattern takes clues from downbeat MACD conditions, failure to cross two-week-old resistance.
  • 200-bar SMA adds to the downside filters, 1.3800 offers an additional upside hurdle.

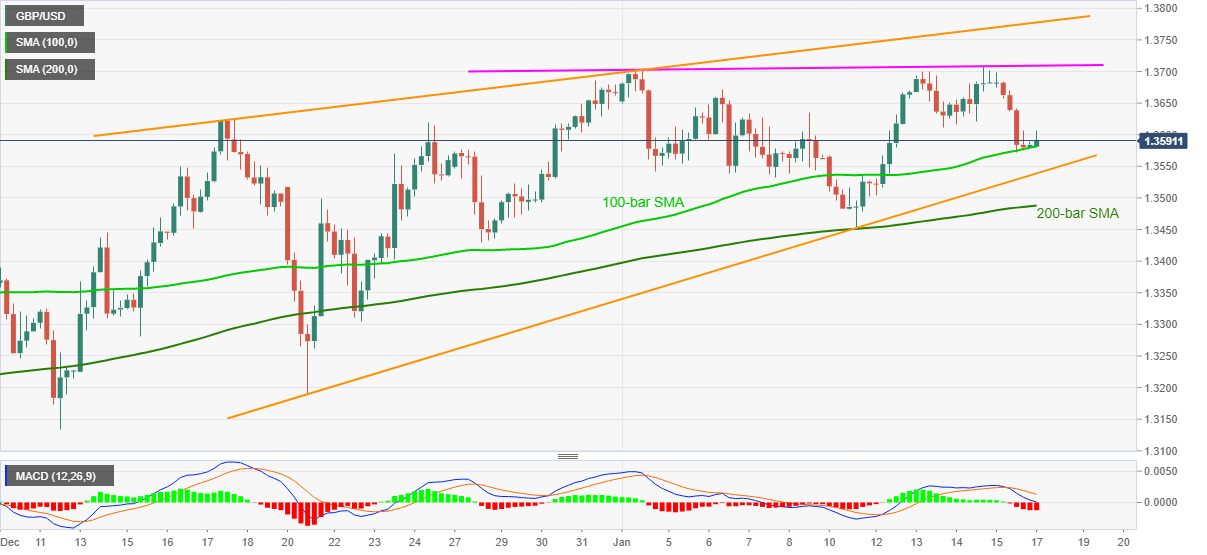
GBP/USD fails to keep the uptick beyond 1.3606, currently around 1.3590, during the initial Asian trading on Monday. The cable dropped to the lowest since January 12 on Friday but couldn’t slip beneath the 100-bar SMA. However, rising wedge formation on the four-hour (4H) chart joins bearish MACD conditions to keep sellers hopeful.

Not only 100-bar SMA near 1.3580 but 200-bar SMA around 1.3485 also acts as an extra barrier for the GBP/USD sellers’ entry even if they manage to confirm the stated bearish formation by breaking 1.3535 pattern support.

It should be noted that the monthly low of around 1.3450 and the previous month’s low close to 1.3130 will probe the GBP/USD bears targeting the theoretical signal from the rising wedge, around 1.3000 round-figure.

Alternatively, 1.3615 and 1.3670 can entertain short-term buyers ahead of challenging them by an ascending trend line from January 04, at 1.3710 now.

In a case where GBP/USD buyers manage to cross 1.3710, the stated bearish formation’s upper line near 1.3780 and the 1.3800 threshold can also challenge the quote’s further upside.

Overall, GBP/USD seems to fade the upside momentum and hence sellers should wait for a clear bearish signal for entry.

GBP/USD four-hour chart

Trend: Pullback expected

Additional important levels

Overview
Today last price 1.3592
Today Daily Change 8 pips
Today Daily Change % 0.06%
Today daily open 1.3584
 
Trends
Daily SMA20 1.3567
Daily SMA50 1.3426
Daily SMA100 1.3204
Daily SMA200 1.2914
 
Levels
Previous Daily High 1.3698
Previous Daily Low 1.3572
Previous Weekly High 1.371
Previous Weekly Low 1.3451
Previous Monthly High 1.3686
Previous Monthly Low 1.3134
Daily Fibonacci 38.2% 1.3621
Daily Fibonacci 61.8% 1.365
Daily Pivot Point S1 1.3538
Daily Pivot Point S2 1.3492
Daily Pivot Point S3 1.3412
Daily Pivot Point R1 1.3664
Daily Pivot Point R2 1.3744
Daily Pivot Point R3 1.379


Share: Feed news

Information on these pages contains forward-looking statements that involve risks and uncertainties. Markets and instruments profiled on this page are for informational purposes only and should not in any way come across as a recommendation to buy or sell in these assets. You should do your own thorough research before making any investment decisions. FXStreet does not in any way guarantee that this information is free from mistakes, errors, or material misstatements. It also does not guarantee that this information is of a timely nature. Investing in Open Markets involves a great deal of risk, including the loss of all or a portion of your investment, as well as emotional distress. All risks, losses and costs associated with investing, including total loss of principal, are your responsibility. The views and opinions expressed in this article are those of the authors and do not necessarily reflect the official policy or position of FXStreet nor its advertisers. The author will not be held responsible for information that is found at the end of links posted on this page.

If not otherwise explicitly mentioned in the body of the article, at the time of writing, the author has no position in any stock mentioned in this article and no business relationship with any company mentioned. The author has not received compensation for writing this article, other than from FXStreet.

FXStreet and the author do not provide personalized recommendations. The author makes no representations as to the accuracy, completeness, or suitability of this information. FXStreet and the author will not be liable for any errors, omissions or any losses, injuries or damages arising from this information and its display or use. Errors and omissions excepted.

The author and FXStreet are not registered investment advisors and nothing in this article is intended to be investment advice.

Recommended content


Recommended content

Editors’ Picks

EUR/USD edges lower toward 1.0700 post-US PCE

EUR/USD edges lower toward 1.0700 post-US PCE

EUR/USD stays under modest bearish pressure but manages to hold above 1.0700 in the American session on Friday. The US Dollar (USD) gathers strength against its rivals after the stronger-than-forecast PCE inflation data, not allowing the pair to gain traction.

EUR/USD News

GBP/USD retreats to 1.2500 on renewed USD strength

GBP/USD retreats to 1.2500 on renewed USD strength

GBP/USD lost its traction and turned negative on the day near 1.2500. Following the stronger-than-expected PCE inflation readings from the US, the USD stays resilient and makes it difficult for the pair to gather recovery momentum.

GBP/USD News

Gold struggles to hold above $2,350 following US inflation

Gold struggles to hold above $2,350 following US inflation

Gold turned south and declined toward $2,340, erasing a large portion of its daily gains, as the USD benefited from PCE inflation data. The benchmark 10-year US yield, however, stays in negative territory and helps XAU/USD limit its losses. 

Gold News

Bitcoin Weekly Forecast: BTC’s next breakout could propel it to $80,000 Premium

Bitcoin Weekly Forecast: BTC’s next breakout could propel it to $80,000

Bitcoin’s recent price consolidation could be nearing its end as technical indicators and on-chain metrics suggest a potential upward breakout. However, this move would not be straightforward and could punish impatient investors. 

Read more

Week ahead – Hawkish risk as Fed and NFP on tap, Eurozone data eyed too

Week ahead – Hawkish risk as Fed and NFP on tap, Eurozone data eyed too

Fed meets on Wednesday as US inflation stays elevated. Will Friday’s jobs report bring relief or more angst for the markets? Eurozone flash GDP and CPI numbers in focus for the Euro.

Read more

Forex MAJORS

Cryptocurrencies

Signatures