|

GBP/USD Price Analysis: Acceptance above 23.6% Fibo. favors bulls ahead of US Q1 GDP

  • GBP/USD struggles to attract follow-through buying and trades in a narrow range on Thursday.
  • Reduced Fed rate cut bets and speculations about more aggressive BoE easing act as a headwind.
  • The technical setup warrants some caution before positioning for any further appreciating move.

The GBP/USD pair consolidates its strong recovery gains registered over the past two days, from the 1.2300 mark or the YTD low set earlier this week and oscillates in a range during the Asian session on Thursday. Spot prices currently trade near the 1.2465 region, unchanged for the day as traders await more cues about the Federal Reserve's (Fed) rate-cut path before placing fresh directional bets. 

Hence, the focus will remain glued to important US macro data – the Advance Q1 GDP report later today and the Personal Consumption Expenditures (PCE) Price Index on Friday. In the meantime, expectations that the Fed will delay cutting interest rates in the wake of sticky inflation continue to act as a tailwind for the US Dollar (USD). Apart from this, speculations about more aggressive policy easing by the Bank of England (BoE) undermine demand for the British Pound (GBP) and act as a headwind for the GBP/USD pair. 

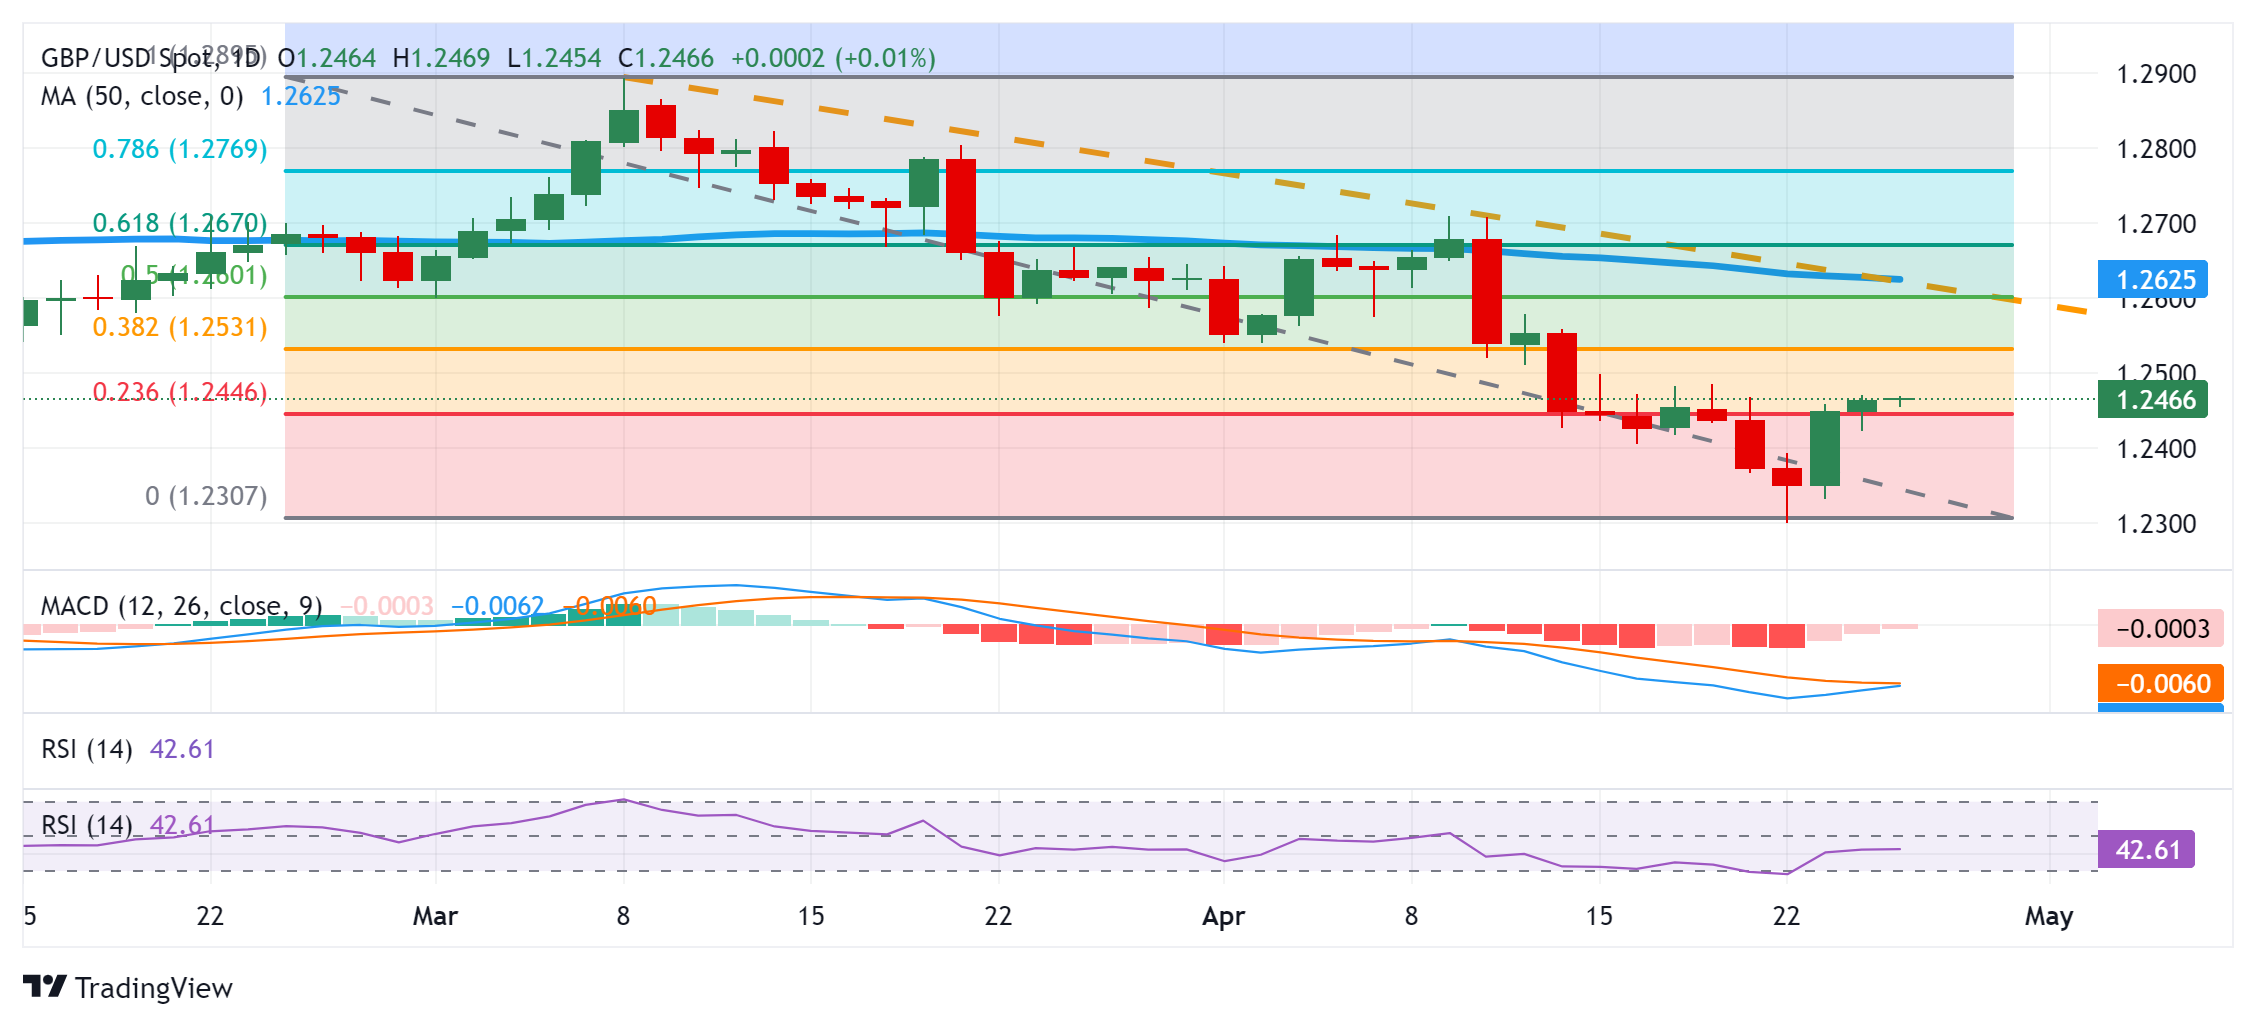
From a technical perspective, acceptance above the 23.6% Fibonacci retracement level of the March-April downfall favors bullish traders and supports prospects for a further appreciating move. Hence, some follow-through strength beyond the 1.2500 psychological mark, en route to the 1.2530-1.2535 region or the 38.2% Fibo. level, looks like a distinct possibility. That said, oscillators on the daily chart are still holding in the negative territory, suggesting that the latter should act as a headwind and cap the upside for the GBP/USD pair. 

On the flip side, the 1.2425 area now seems to protect the immediate downside ahead of the 1.2400 round figure. Some follow-through selling could drag the GBP/USD pair back towards the 1.2350 intermediate support en route to the 1.2300 mark, or the YTD low touched on Tuesday. A convincing break below the latter will be seen as a fresh trigger for bearish traders and pave the way for an extension of the recent downtrend from the March swing high. Spot prices might then slide to the 1.2245 area before dropping to the 1.2200 mark.

GBP/USD daily chart

fxsoriginal

GBP/USD

Overview
Today last price1.2465
Today Daily Change0.0001
Today Daily Change %0.01
Today daily open1.2464
 
Trends
Daily SMA201.2529
Daily SMA501.2627
Daily SMA1001.2651
Daily SMA2001.256
 
Levels
Previous Daily High1.247
Previous Daily Low1.2423
Previous Weekly High1.2499
Previous Weekly Low1.2367
Previous Monthly High1.2894
Previous Monthly Low1.2575
Daily Fibonacci 38.2%1.2452
Daily Fibonacci 61.8%1.2441
Daily Pivot Point S11.2434
Daily Pivot Point S21.2405
Daily Pivot Point S31.2387
Daily Pivot Point R11.2482
Daily Pivot Point R21.2499
Daily Pivot Point R31.2529

Author

Haresh Menghani

Haresh Menghani is a detail-oriented professional with 10+ years of extensive experience in analysing the global financial markets.

More from Haresh Menghani
Share:

Markets move fast. We move first.

Orange Juice Newsletter brings you expert driven insights - not headlines. Every day on your inbox.

By subscribing you agree to our Terms and conditions.

Editor's Picks

EUR/USD struggles for direction amid USD gains

EUR/USD is trimming part of its earlier gains, coming under some mild downside pressure near 1.1730 as the US Dollar edges higher. Markets are still digesting the Fed’s latest rate decision, while also looking ahead to more commentary from Fed officials in the sessions ahead.

GBP/USD drops to daily lows near 1.3360

Disappointing UK data weighed on the Sterling towards the end of the week, triggering a pullback in GBP/USD to fresh daily lows near 1.3360. Looking ahead, the next key event across the Channel is the BoE meeting on December 18.

Gold losses momentum, challenges $4,300

Gold now gives away some gains and disputes the key $4,300 zone per troy ounce following earlier multi-week highs. The move is being driven by expectations that the Fed will deliver further rate cuts next year, with the yellow metal climbing despite a firmer Greenback and rising US Treasury yields across the board.

Litecoin Price Forecast: LTC struggles to extend gains, bullish bets at risk

Litecoin (LTC) price steadies above $80 at press time on Friday, following a reversal from the $87 resistance level on Wednesday. Derivatives data suggests a bullish positional buildup while the LTC futures Open Interest declines, flashing a long squeeze risk.

Big week ends with big doubts

The S&P 500 continued to push higher yesterday as the US 2-year yield wavered around the 3.50% mark following a Federal Reserve (Fed) rate cut earlier this week that was ultimately perceived as not that hawkish after all. The cut is especially boosting the non-tech pockets of the market.

Aave Price Forecast: AAVE primed for breakout as bullish signals strengthen

Aave (AAVE) price is trading above $204 at the time of writing on Friday and approaching the upper boundary of its descending parallel channel; a breakout from this structure would favor the bulls.