|

GBP/USD Price Analysis: 100-SMA tests bears below 1.2500

  • GBP/USD remains depressed around two-week low, sidelined of late.
  • Clear downside break of short-term key support, 200-SMA keep sellers hopeful.
  • RSI conditions, 100-SMA restrict immediate downside ahead of the multi-month low marked in May.

GBP/USD licks its wounds around a fortnight low, after dropping the most in two weeks, as the 100-SMA probes the downturn during Thursday’s Asian session. Even so, the cable pair stays pressured around 1.2480-80 levels by the press time.

Although nearly oversold RSI (14) joins the 100-SMA to challenge the pair sellers around 1.2460, bearish MACD signals and sustained trading below 200-SMA keep sellers hopeful.

Also favoring the bears is the pair’s downside break of an ascending support line from May 13, now resistance around 1.2700.

It’s worth noting, however, that multiple supports around the 23.6% Fibonacci retracement (Fibo.) of April-May fall could challenge the GBP/USD bears around 1.2385, even if the quote drops below the 100-SMA level of 1.2460.

Following that, a broad one-month-old horizontal area surrounding 1.2275-55 will be a tough nut to crack for the pair sellers.

On the contrary, recovery moves could initially aim for the 200-SMA and May’s peak, respectively around 1.2550 and 1.2670, before targeting the support-turned-resistance line near 1.2700.

Should the GBP/USD bulls manage to keep reins past 1.2700, the 61.8% Fibonacci retracement level of 1.2765 will be in focus.

GBP/USD: Four-hour chart
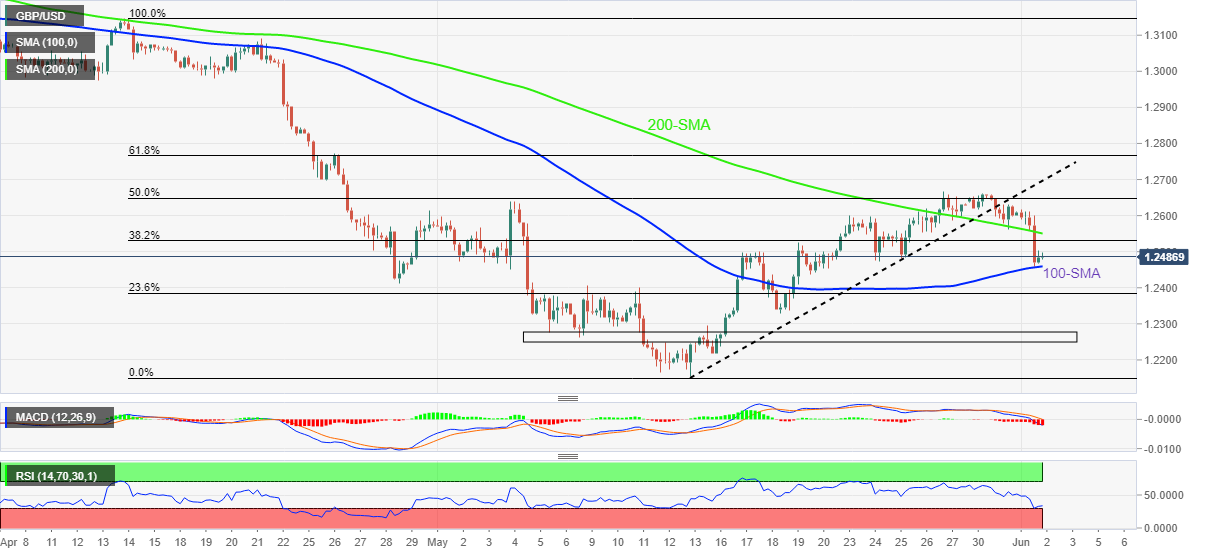
Trend: Further weakness expected

Additional important levels

Overview
Today last price1.2486
Today Daily Change-0.0118
Today Daily Change %-0.94%
Today daily open1.2604
 
Trends
Daily SMA201.2449
Daily SMA501.2752
Daily SMA1001.3089
Daily SMA2001.3322
 
Levels
Previous Daily High1.2656
Previous Daily Low1.2561
Previous Weekly High1.2667
Previous Weekly Low1.2472
Previous Monthly High1.2667
Previous Monthly Low1.2155
Daily Fibonacci 38.2%1.2597
Daily Fibonacci 61.8%1.262
Daily Pivot Point S11.2557
Daily Pivot Point S21.2511
Daily Pivot Point S31.2462
Daily Pivot Point R11.2653
Daily Pivot Point R21.2703
Daily Pivot Point R31.2749

Author

Anil Panchal

Anil Panchal

FXStreet

Anil Panchal has nearly 15 years of experience in tracking financial markets. With a keen interest in macroeconomics, Anil aptly tracks global news/updates and stays well-informed about the global financial moves and their implications.


More from Anil Panchal
Share:

Editor's Picks

GBP/USD trims gains; back to 1.3450-ish

The persistent weakness hurting the Greenback lends support to the British Pound and the rest of the risk-linked assets, sending GBP/USD to new two-day tops past 1.3480 on Wednesday. Indeed, Cable advances for the second day in a row helped by the constant optimism around a potential US-Iran deal.

EUR/USD hovers around two-month peaks near 1.1560

EUR/USD advances for the second day in a row, challenging multi-week highs in the 1.1560 zone on Wednesday. The persistent weakness hitting the US Dollar underpins the move higher in spot while market participants continue to closely follow developments from the Middle East and gear up for upcoming key data releases in the US jobs market. On Thursday, all the attention will be on the release of weekly Claims alongside Challenger Job Cuts.

How Wall Street rigs the game [Video]

In this week’s Live from the Vault, Andrew Maguire is joined by Peter Antico and Sean Stone to discuss the Paradigm of Money - an in-depth expose of financial market corruption, from naked shorting to the two-tier system that protects Wall Street.

Bitcoin stalls despite strong market activity across traditional assets
Bitcoin (BTC) remained subdued while stocks edged higher and gold lower, suggesting the market is trapped between weakening institutional demand and growing signs of seller exhaustion, according to a Glassnode report on Wednesday.
Why the WTI sell-off may be hiding a supply warning
Prices for the barrel of the American Oil benchmark have fallen sharply as hopes of a US-Iran agreement have resurfaced, but a deeply backwardated Oil curve, tight Cushing stocks and light speculative positioning all warn that the sell-off may have gone too far.
9-3: Is the Federal Reserve’s vote tally Warsh's new forward guidance?
The rate did not move. Neither did the statement, and that’s the more interesting fact. Set the July 29 Federal Open Market Committee (FOMC) statement beside the one issued on June 17, and the two documents are identical apart from a single verb and a paragraph at the bottom naming three dissenters.