GBP/USD holding above 1.2700 after US PCE inflation keeps rate cut hopes pinned to the ceiling
- The GBP/USD is holding on the high side after US PCE inflation settled further on Friday.
- UK Retail Sales grew in November, Pound Sterling bidders shrug off UK GDP QoQ decline.
- US Dollar flows are decidedly bearish, propping up the broader market.

The GBP/USD is on the high side amidst some rough chop in the US market session, holding above the 1.2700 handle the pair reclaimed during the European trading window after the UK reported better-than-expected Retail Sales in November.
Read More: UK Retail Sales rise 1.3% in November, Q3 GDP growth revised lower to 0.3%
UK Retail Sales grew 1.3% MoM in November, beating the forecast 0.4% and rebounding from October’s flat print of 0.0%. Annualized Retail Sales through November also gained on market forecasts, printing at 0.1% versus the forecast -1.3%, rebounding from the previous period’s -2.5% (revised upwards slightly from -2.7%).
Upbeat UK Retail Sales helped Pound Sterling bidders shake off a miss in the UK Gross Domestic Product (GDP) print, which came in below expectations. Annualized quarterly UK GDP came in at just 0.3% versus the forecast hold at 0.6%, with quarterly GDP declining QoQ, coming in at -0.1% versus the forecast 0.0% flat reading.
US data took center stage again on Friday, with decelerating inflation being the key driver, pushing the US Dollar down across the broader market.
Read More: US PCE inflation softens to 2.6% from a year ago vs. 2.8% expected
US Personal Consumption Expenditure (PCE) Price Index figures for November showed inflation continues to slow at a faster pace than markets initially expected. Annualized Core PCE inflation for the year through November printed at 3.2%, below the 3.3% forecast and lower than the previous period’s 3.4% print (revised down slightly from 3.5%).
Read More: US Durable Goods Orders rise 5.4% in November vs 2.2% expected
US Durable Goods Orders added to the mix, implying the US economy might not be outright weakening as quickly as rate-cut-hungry investors might be hoping for; November’s Durable Goods Orders came in at a surprisingly robust 5.4%, easily clearing the forecast 2.2% and rebounding from the previous period’s -5.1%(revised from -5.4%).
GBP/USD Technical Outlook
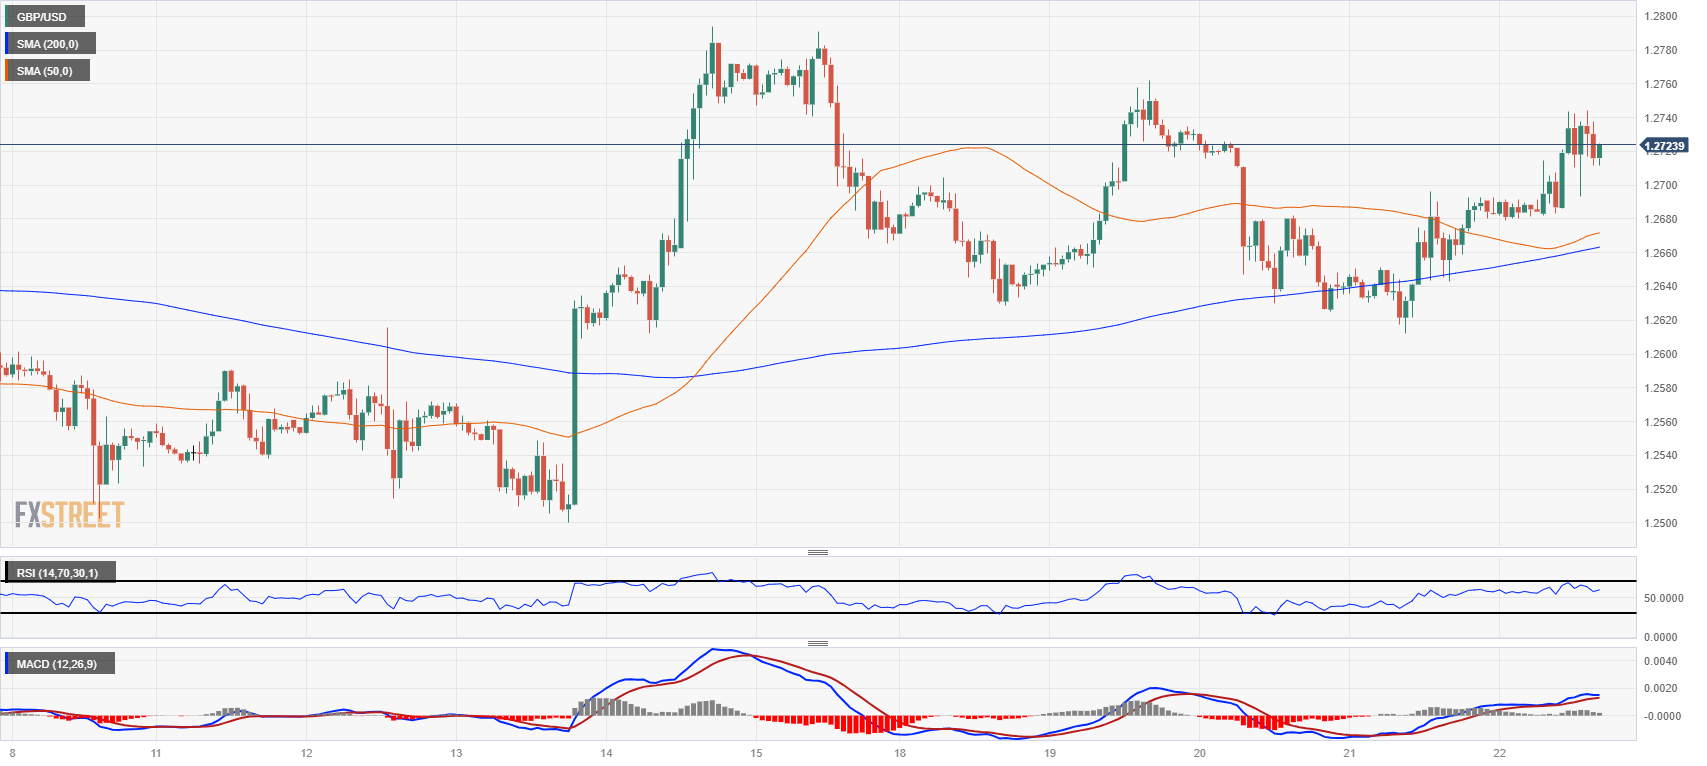
The GBP/USD found some room above the 1.2700 handle on the final Friday before the holiday break, testing just below 1.2750 before falling back into intraday consolidation between 1.2740 and 1.2710.
The Pound Sterling has been bolstered against the US Dollar, bouncing off of the 200-hour Simple Moving Average (SMA) rising through 1.2660, but failure to break near-term highs near 1.2760 leaves bullish momentum capped.
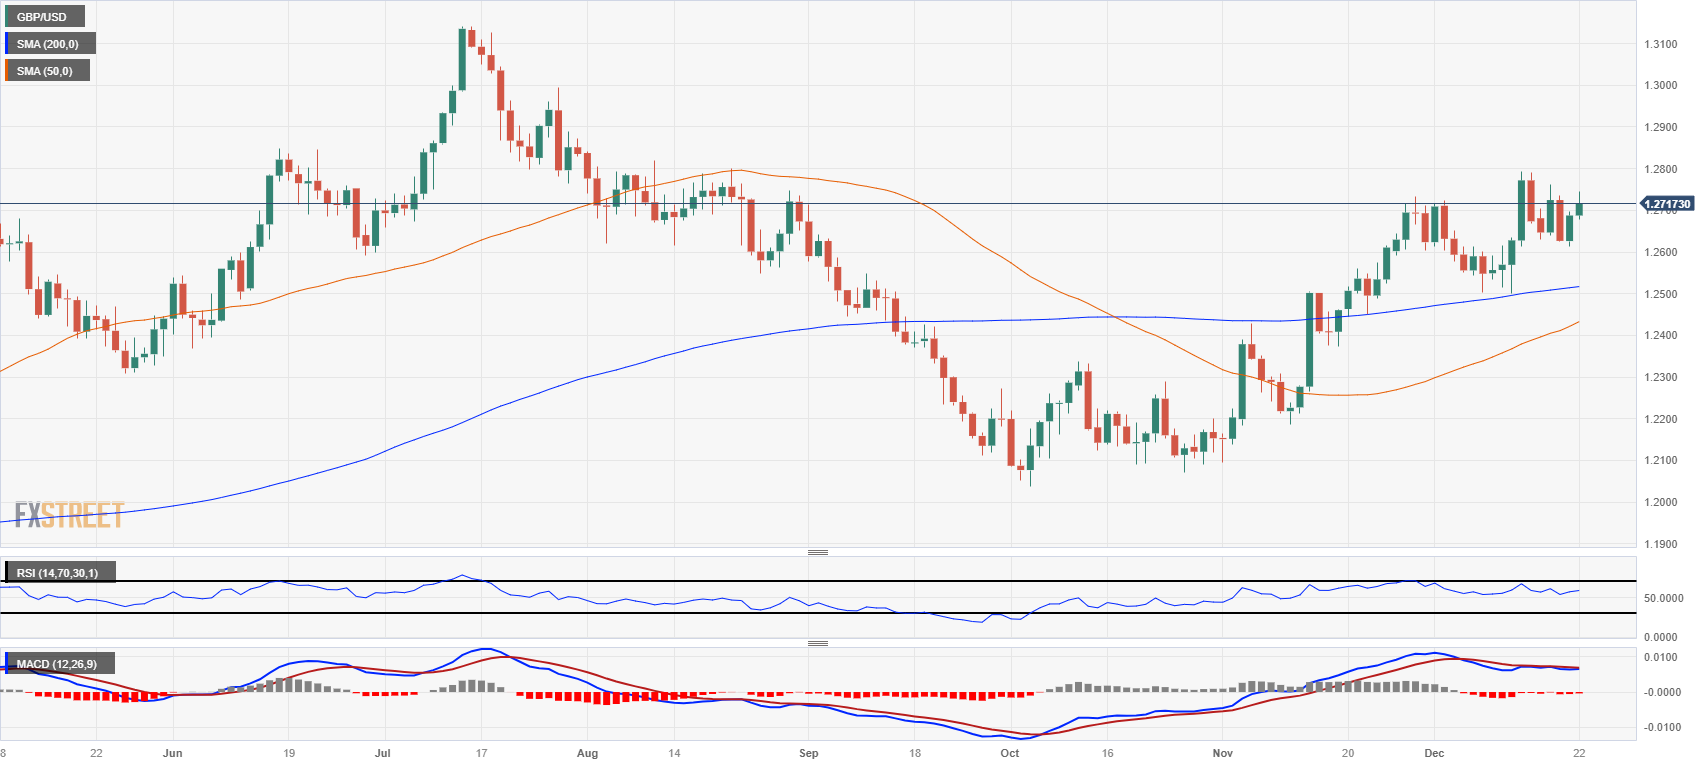
1.2800 is proving a vexing handle to reclaim for the Pound Sterling, having shed the price level in August and getting rejected from the region last week.
The GBP/USD continues to trade north of the 200-day SMA just above 1.2500, but an extended pullback could be due with the Moving Average Convergence-Divergence (MACD) showing signs of technical exhaustion in overbought territory.
GBP/USD Hourly Chart
GBP/USD Daily Chart
GBP/USD Technical Levels
Author

Joshua Gibson
FXStreet
Joshua joins the FXStreet team as an Economics and Finance double major from Vancouver Island University with twelve years' experience as an independent trader focusing on technical analysis.















