GBP/USD gains traction and reclaimed 1.2000 as the GBP prepares for weekly losses
- GBP/USD is set to finish the week with losses of 0.16%.
- Softer UK’s inflation data warrant further action by the BoE but in smaller steps.
- Hotter-than-expected January US CPI and PPI figures justify Fed official’s calls for a 50 bps increase in upcoming meetings.

The GBP/USD is staging a recovery after diving to fresh February lows around 1.1914 in the mid-North American session, bolstered by overall US Dollar (USD) weakness. Nevertheless, it remains trading below the important 200-day Exponential Moving Average (EMA) at 1.2132, keeping the downtrend intact. At the time of writing, the GBP/USD is exchanging hands above the 1.2020 figure, above its opening price by 0.30%.
GBP/USD pressured by an expected Fed aggressive path, compared to the BoE
Data from both sides of the Atlantic kept the GBP/USD pressured, which finally dropped below the 200-day EMA. A UK inflation report on Tuesday contributed to speculations that the Bank of England (BoE) would not hike rates as aggressively as expected. That, alongside softer than expected Consumer Price Index (CPI) for January in the US, which exceeded estimates by bank analysts, incremented the likelihood of further tightening by the US Federal Reserve (Fed).
The last piece of the puzzle that propelled US Treasury bond yields and the US Dollar (USD) was the Producer Price Index (PPI) for January, with data coming higher than estimates on a monthly basis. That spurred hawkish commentary by two Federal Reserve (Fed) officials, who said that rates need to be higher for longer, foreseeing them above the 5.0% threshold.
Another factor that influenced investors’ reaction was the Philadelphia Fed Manufacturing Index, which collapsed, but comments in the poll by business executives commented that input prices jumped for the first time in 10 months. Given the backdrop, money market futures are pricing in a more hawkish Federal Reserve.
Therefore, the GBP/USD extended its losses on Thursday, dropping 0.26%. But as the New York session progresses, the Pound Sterling (GBP) has gained traction against the US Dollar (USD), setting the stage to challenge the 100-day EMA.
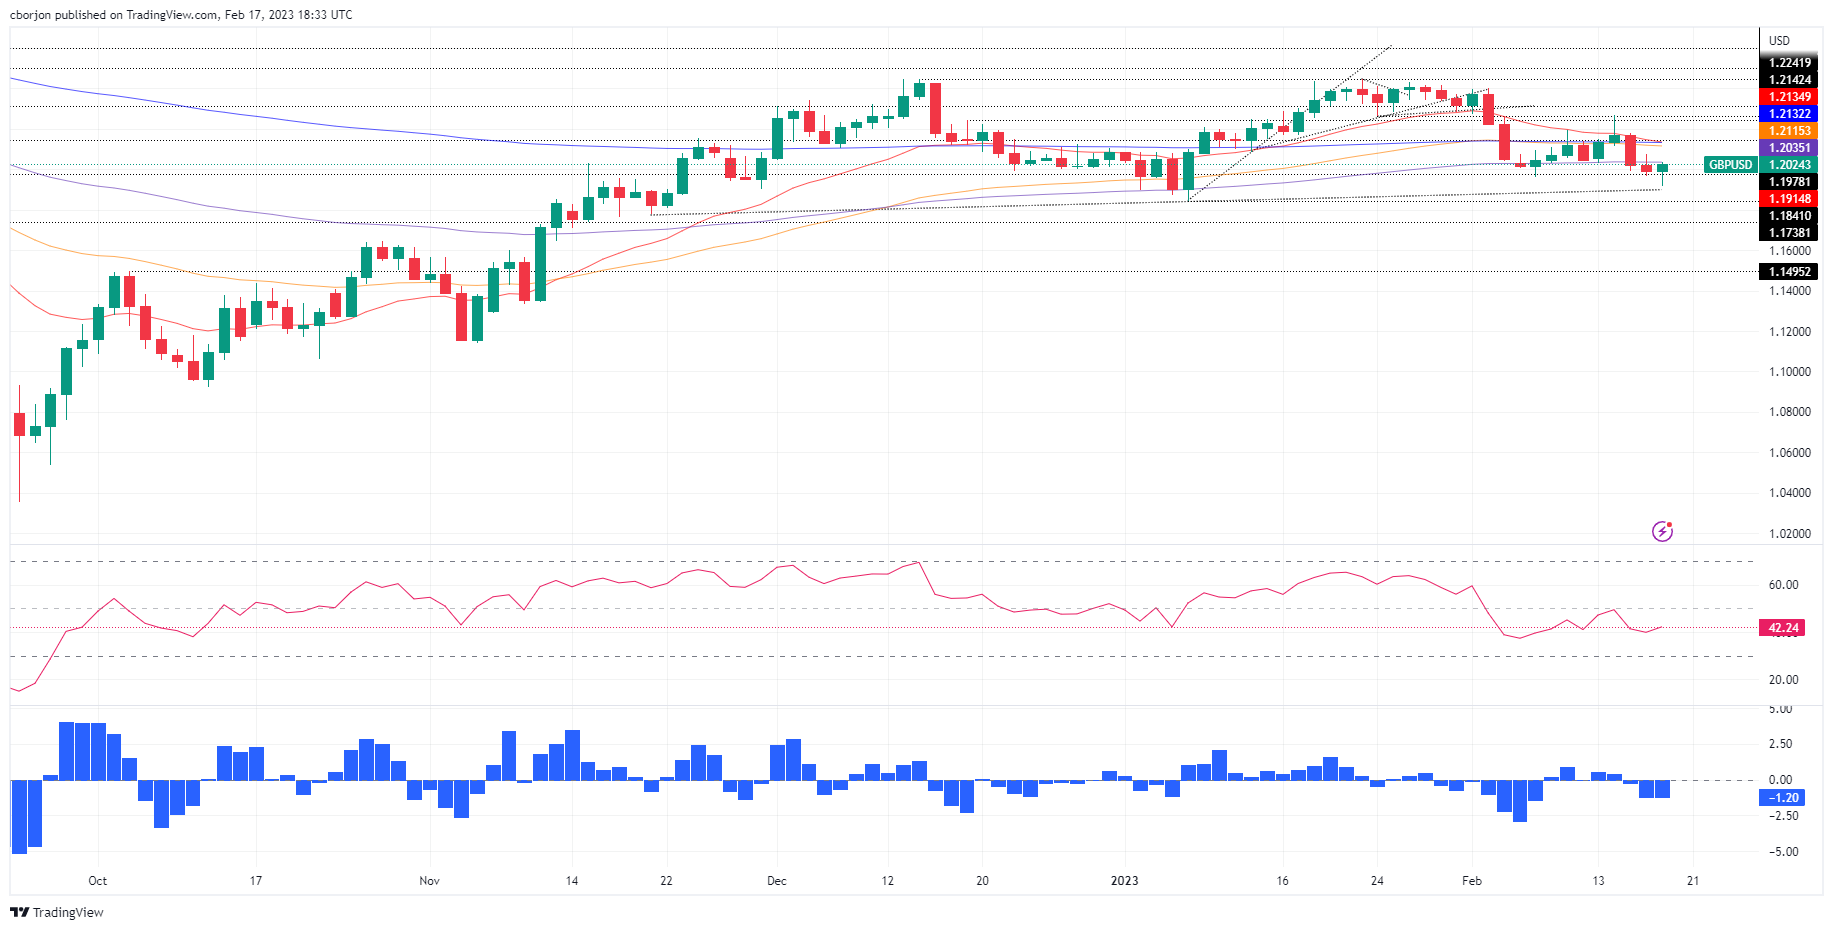
GBP/USD Technical analysis
The GBP/USD pair daily chart portrays the pair as downward biased, even though it’s recovering from falling for two straight days. The major found buyers around the 1.1900 area, which triggered an uptick to the day’s high at 1.2037, the 100-day EMA, where the GBP/USD was quickly rejected.
If the GBP/USD achieves a daily close above the 100-day EMA, the pair will rally toward the confluence of the 200 and 20-day EMAs, each at 1.2132/35, respectively. On the other hand, a bearish resumption could happen once the GBP/USD tumbles below 1.1914, followed by the 1.1900 figure.
Author

Christian Borjon Valencia
FXStreet
Markets analyst, news editor, and trading instructor with over 14 years of experience across FX, commodities, US equity indices, and global macro markets.


