|

GBP/JPY technical analysis: Struggles between 7-month-old trendline, 200-day SMA

  • GBP/JPY steps back from the late-May top, downward sloping resistance line since mid-March.
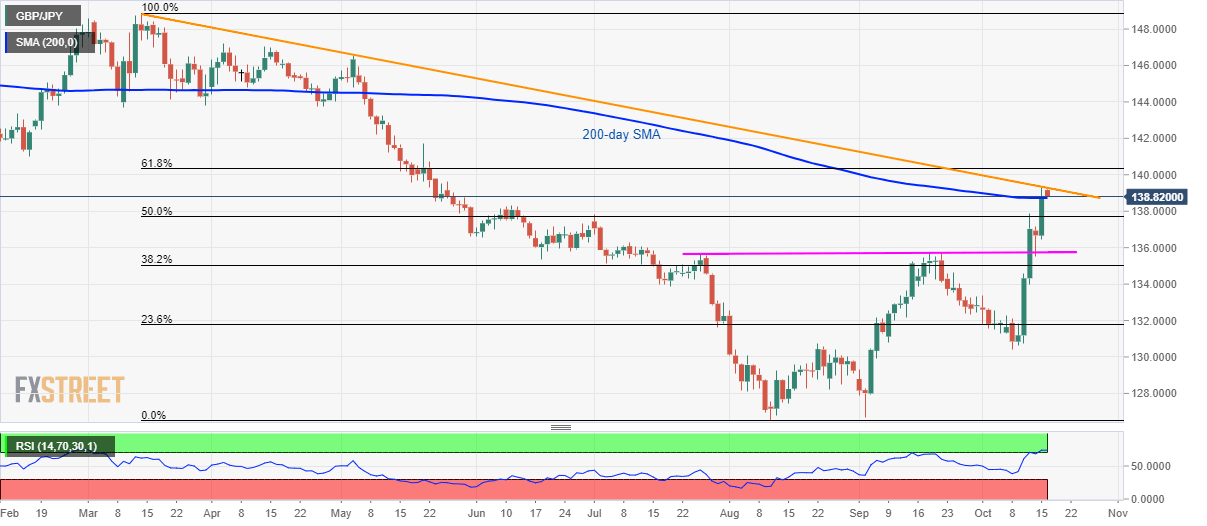
  • Sellers await downside break of 200-day SMA amid overbought RSI conditions.

In addition to the failure to rise beyond multi-month old falling trend line, overbought conditions of 14-bar Relative Strength Index (RSI) also trigger the GBP/JPY pair’s pullback to 138.87 during Wednesday’s Asian session.

Sellers await the downside break of the 200-day Simple Moving Average (SMA) level of 138.72 to enter while targeting July month high of 137.80.

However, pair’s declines below 137.80 might not refrain from challenging 135.65/75 area including tops marked in late-July and September.

On the upside, pair’s sustained trading beyond a downward sloping trend line since mid-March, at 139.30, could escalate the run-up to 140.00 and 61.8% Fibonacci retracement of the downside since March month, at 140.35.

During the pair’s further rise above 140.35, late-May tops nearing 141.80 will be on the bulls’ radar.

GBP/JPY daily chart

Trend: pullback expected

additional important levels

Overview
Today last price138.83
Today Daily Change2.16
Today Daily Change %1.58%
Today daily open136.67
 
Trends
Daily SMA20133.43
Daily SMA50131.42
Daily SMA100133.54
Daily SMA200138.72
 
Levels
Previous Daily High137.18
Previous Daily Low135.5
Previous Weekly High137.9
Previous Weekly Low130.42
Previous Monthly High135.75
Previous Monthly Low126.67
Daily Fibonacci 38.2%136.14
Daily Fibonacci 61.8%136.54
Daily Pivot Point S1135.72
Daily Pivot Point S2134.77
Daily Pivot Point S3134.04
Daily Pivot Point R1137.4
Daily Pivot Point R2138.13
Daily Pivot Point R3139.08

Author

Anil Panchal

Anil Panchal

FXStreet

Anil Panchal has nearly 15 years of experience in tracking financial markets. With a keen interest in macroeconomics, Anil aptly tracks global news/updates and stays well-informed about the global financial moves and their implications.

More from Anil Panchal
Share:

Editor's Picks

EUR/USD recedes to daily lows near 1.1850

EUR/USD keeps its bearish momentum well in place, slipping back to the area of 1.1850 to hit daily lows on Monday. The pair’s continuation of the leg lower comes amid decent gains in the US Dollar in a context of scarce volatility and thin trade conditions due to the inactivity in the US markets.

GBP/USD resumes the downtrend, back to the low-1.3600s

GBP/USD rapidly leaves behind Friday’s decent advance, refocusing on the downside and retreating to the 1.3630 region at the beginning of the week. In the meantime, the British Pound is expected to remain under the microscope ahead of the release of the key UK labour market report on Tuesday.

Gold corrects lower, tries to stabilize above $5,000

Gold started the week under bearish pressure and declined to the $4,960 area before staging a modest rebound. As trading volumes remain thin with the US financial markets remaining closed on Presidents' Day holiday, XAU/USD looks to stabilize above $5,000 ahead of this week's key data releases.

Bitcoin consolidates as on-chain data show mixed signals

Bitcoin price has consolidated between $65,700 and $72,000 over the past nine days, with no clear directional bias. US-listed spot ETFs recorded a $359.91 million weekly outflow, marking the fourth consecutive week of withdrawals.

The week ahead: Key inflation readings and why the AI trade could be overdone

It is likely to be a quiet start to the week, with US markets closed on Monday for Presidents Day. European markets are higher across the board and gold is clinging to the $5,000 level after the tamer than expected CPI report in the US reduced haven flows to precious metals.

Monero Price Forecast: XMR risks a drop below $300 under mounting bearish pressure

Monero (XMR) starts the week under pressure, recording a 4% decline at press time on Monday after a 7% drop the previous day, putting the $300 support zone in focus.