GBP/JPY technical analysis: Eyes 30-day MA hurdle
- GBPJPY's daily chart shows a bullish candlestick pattern.
- The 4-hour chart shows a falling wedge breakout.

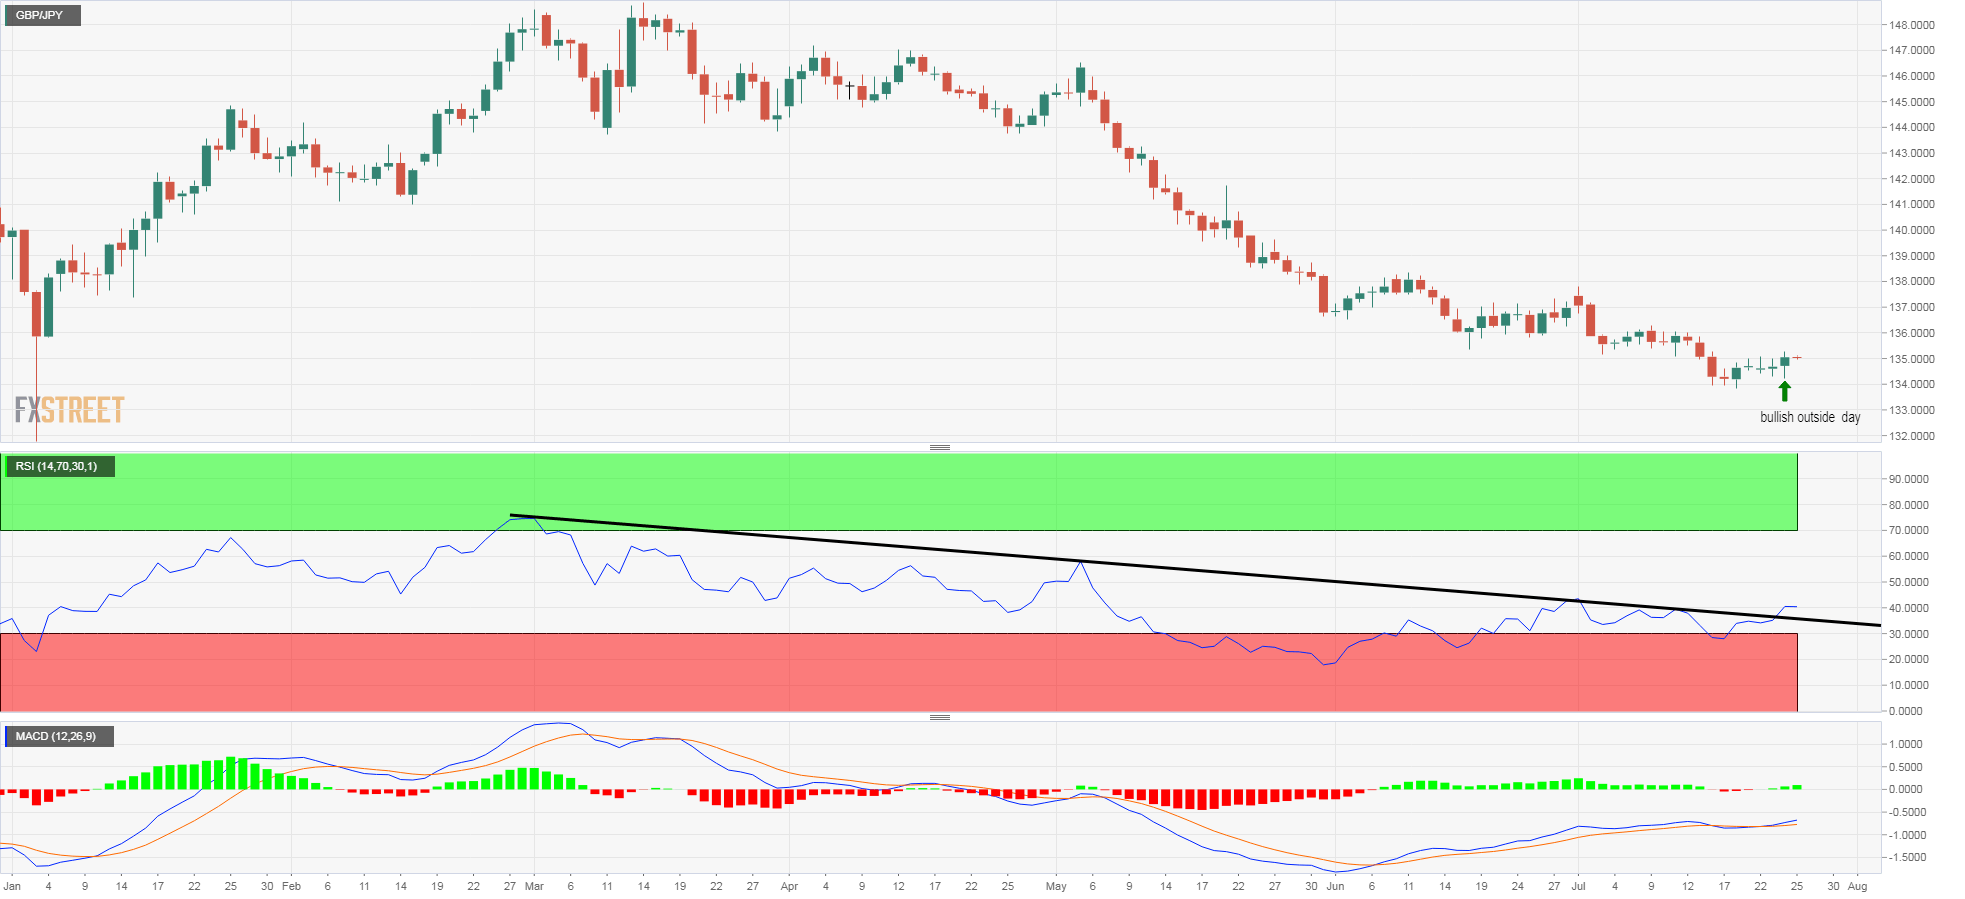
GBP/JPY is looking north at the descending 30-day moving average (MA) of 135.82, having confirmed a bullish candlestick pattern on Wednesday.
The currency pair created a bullish outside day on Wednesday and closed above 134.99, validating Tuesday's doji candle.
The 14-day relative strength index (RSI) has also violated the descending trendline and the moving average convergence divergence (MACD) is reporting bullish conditions with an above-zero print.
What's more, the 4-hour chart is reporting a falling wedge breakout, a bullish reversal pattern.
As a result, the path of least resistance is to the high side and the pair could rise to 135.82 during the day ahead. As of writing, the pair is trading largely unchanged on the day at 135.04.
Daily chart
4-hour chart
-636996166378720033.png)
Trend: Bullish
Pivot points
Author

Omkar Godbole
FXStreet Contributor
Omkar Godbole, editor and analyst, joined FXStreet after four years as a research analyst at several Indian brokerage companies.


