GBP/JPY Price Analysis: The inverted head-and-shoulders target was achieved, hovers around 167.00
- On Tuesday, the GBP/JPY reached the inverted head-and-shoulders chart pattern at 167.00.
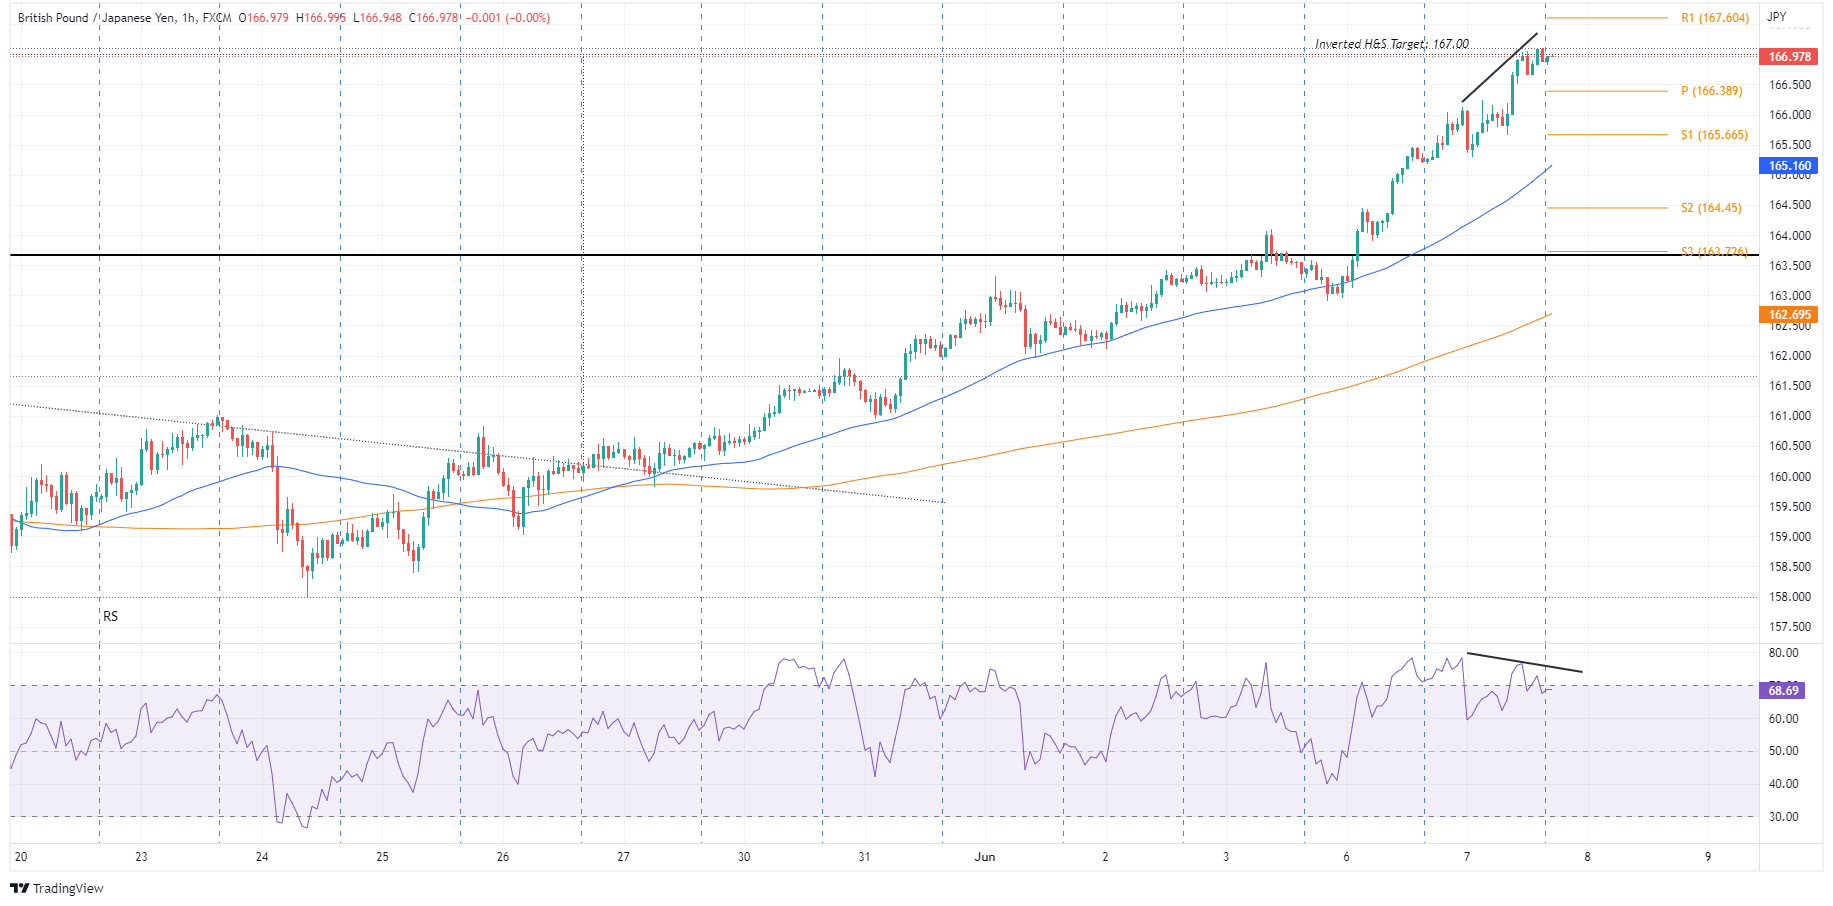
- GBP/JPY Price Forecast: A negative divergence in the 1-hour chart might open the door for a pullback towards 165.50.

The GBP/JPY rallied during the North American session and reached a fresh-seven-week high above 167.00 for the first time since April 18, though as Wall Street’s closed, the cross-pair retraced towards the high 166.90s. At the time of writing, the GBP/JPY is trading at 166.97.
US equities finished the session in an upbeat mood. UK political turmoil, alongside global central bank tightening conditions, keeps investors uneasy. In fact, the Reserve Bank of Australia (RBA) added its name to the list of central banks, hiking 0.50%, leaving the ECB, the BoJ, and the Swiss National Bank (SNB), behind.
On Monday, UK Prime Minister Boris Johnson achieved a victory on the no-confidence vote. Nevertheless, his position weakened, leaving it exposed after the party-gate on his office, despite Covid-19 restrictions, in 2020. The GBP rallied as a relief to the news, though a slowing economic outlook in the UK puts the stagflation scenario on the table.
On Tuesday, the GBP/JPY opened near the day’s lows, below the 165.50 mark, and began its uptrend. Towards fresh weekly highs. Once European traders got to their desks, the GBP/JPY corrected just above the daily lows and rallied sharply towards 167.00.
GBP/JPY Price Forecast: Technical outlook
On Monday, I wrote a note about an inverted hammer in the daily chart. On Tuesday, the inverted head-and-shoulders target was fulfilled as the GBP/JPY reached a daily high at 167.00, and the next target on the upside would be the YTD high at 168.43. Nevertheless, the Relative Strength Index (RSI) is closing sharply towards overbought conditions, at 68.48, opening the door for consolidation before the uptrend continues.
The GBP/JPY 1-hour chart shows the cross is topping in the near term, confirmed by the RSI. Also, the GBP/JPY price action printed a series of successive higher-highs, but on a weaker momentum, as RSI edges lower, meaning a negative divergence looms. Hence, the GBP/JPY might be headed to the downside.
That said, the GBP/JPY first support would be the daily pivot at 166.38. Break below would expose the S1 daily pivot at 165.66, followed by the S2 pivot at 164.45.
Key Technical Levels
Author

Christian Borjon Valencia
FXStreet
Markets analyst, news editor, and trading instructor with over 14 years of experience across FX, commodities, US equity indices, and global macro markets.


