- The GBP/JPY finished Thursday’s session with minuscule losses of 0.01%.
- GBP/JPY Price Analysis: Subdued, but once 159.00 is cleared, further downside is expected; otherwise, breaks above the 20-DMA, the uptrend will resume.
The GBP/JPY recovered from earlier losses and finished Thursday’s session with minuscule gains after plummeting to daily lows of 157.56. However, the GBP/JPY stages a comeback and is set to finish the gains almost flat. As the Asian Pacific session begins, the GBP/JPY is trading at 159.04.
GBP/JPY Price Analysis: Technical outlook
The daily chart shows that the GBP/JPY remains neutral-to-downward biased but trendless during the last seven days. Even though the GBP/JPY was hit by a jump in volatility, on the Bank of Japan’s decision, the exchange rate settled at around Thursday’s close.
Oscillators like the Relative Strength Index (RSI), although its slope is almost flat at bearish territory, while the Rate of Change (RoC) suggests that buying pressure is fading. Therefore, the GBP/JPY might continue to be range-bound unless it clears the first support/resistance levels.
The GBP/JPY, the first support level, would be the 159.00 psychological level. Once cleared, the next support would be the 158.00 figure, followed by the January 19 daily low of 157.56. As an alternate scenario, and the least likely, the GBP/JPY first resistance would be the 20-day Exponential Moving Average (EMA) at 159.54, followed by 160.00 and then the January 18 daily high of 161.52.
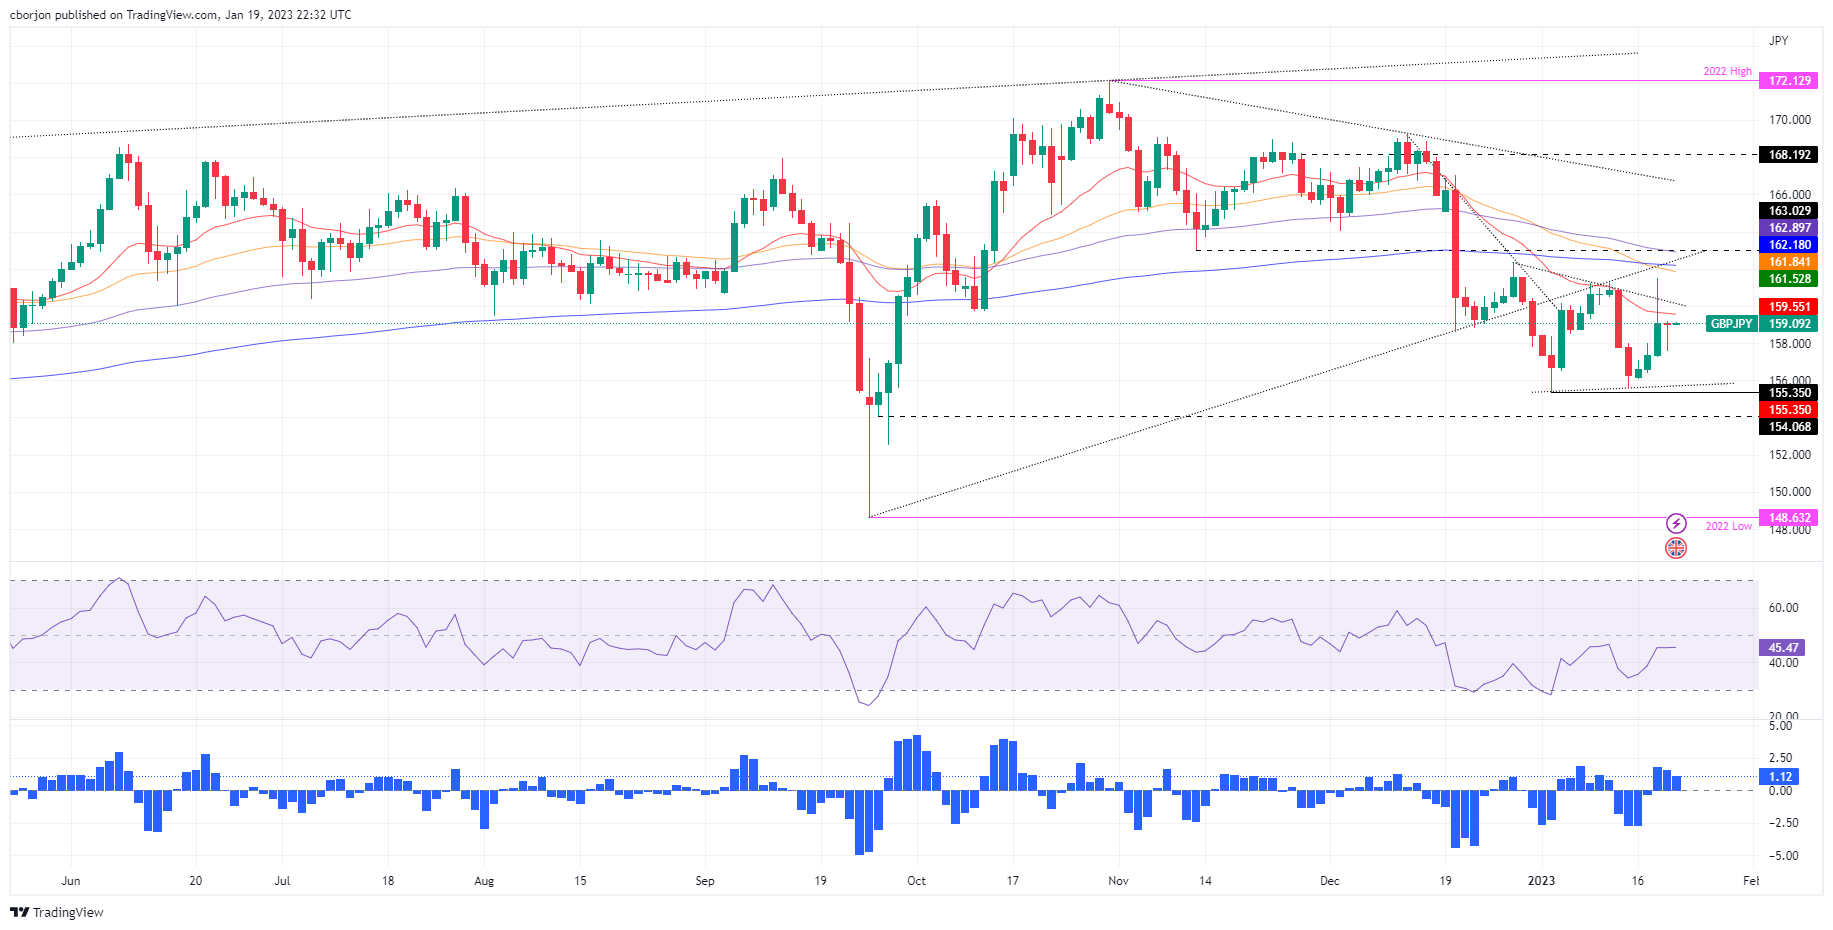
GBP/JPY Key Technical Levels
Information on these pages contains forward-looking statements that involve risks and uncertainties. Markets and instruments profiled on this page are for informational purposes only and should not in any way come across as a recommendation to buy or sell in these assets. You should do your own thorough research before making any investment decisions. FXStreet does not in any way guarantee that this information is free from mistakes, errors, or material misstatements. It also does not guarantee that this information is of a timely nature. Investing in Open Markets involves a great deal of risk, including the loss of all or a portion of your investment, as well as emotional distress. All risks, losses and costs associated with investing, including total loss of principal, are your responsibility. The views and opinions expressed in this article are those of the authors and do not necessarily reflect the official policy or position of FXStreet nor its advertisers. The author will not be held responsible for information that is found at the end of links posted on this page.
If not otherwise explicitly mentioned in the body of the article, at the time of writing, the author has no position in any stock mentioned in this article and no business relationship with any company mentioned. The author has not received compensation for writing this article, other than from FXStreet.
FXStreet and the author do not provide personalized recommendations. The author makes no representations as to the accuracy, completeness, or suitability of this information. FXStreet and the author will not be liable for any errors, omissions or any losses, injuries or damages arising from this information and its display or use. Errors and omissions excepted.
The author and FXStreet are not registered investment advisors and nothing in this article is intended to be investment advice.
Recommended content
Editors’ Picks

GBP/USD rises above 1.3300 after UK Retail Sales data
GBP/USD trades with a positive bias for the third straight day on Friday and hovers above the 1.3300 mark in the European morning on Friday. The data from the UK showed that Retail Sales rose at a stronger pace than expected in August, supporting Pound Sterling.

USD/JPY recovers to 143.00 area during BoJ Governor Ueda's presser
USD/JPY stages a recovery toward 143.00 in the European morning following the initial pullback seen after the BoJ's decision to maintain status quo. In the post-meeting press conference, Governor Ueda reiterated that they will adjust the degree of easing if needed.

Gold price advances further beyond $2,600 mark, fresh record high
Gold price (XAU/USD) gains positive traction for the second successive day on Friday and advances to a fresh record high, beyond the $2,600 mark during the early European session.

Shiba Inu is poised for a rally as price action and on-chain metrics signal bullish momentum
Shiba Inu remains strong on Friday after breaking above a symmetrical triangle pattern on Thursday. This breakout signals bullish momentum, further bolstered by a rise in daily new transactions that suggests a potential rally in the coming days.

Bank of Japan set to keep rates on hold after July’s hike shocked markets
The Bank of Japan is expected to keep its short-term interest rate target between 0.15% and 0.25% on Friday, following the conclusion of its two-day monetary policy review. The decision is set to be announced during the early Asian session.

Moneta Markets review 2024: All you need to know
VERIFIED In this review, the FXStreet team provides an independent and thorough analysis based on direct testing and real experiences with Moneta Markets – an excellent broker for novice to intermediate forex traders who want to broaden their knowledge base.