GBP/JPY Price Analysis: Sellers eye 156.00 on bearish Doji below 200-HMA
- GBP/JPY extends pullback from daily top after flashing bearish candlestick on the hourly chart.
- Failures to cross 200-HMA, weekly resistance line add to the bearish bias.
- 50-HMA offers immediate support ahead of 23.6% Fibonacci retracement.

GBP/JPY remains on the back foot around 156.60, paring intraday gains with the latest U-turn from 156.91 during early Tuesday morning in London.
The pair justifies technical signals to return to the seller’s desk, despite printing mild intraday gains by the press time.
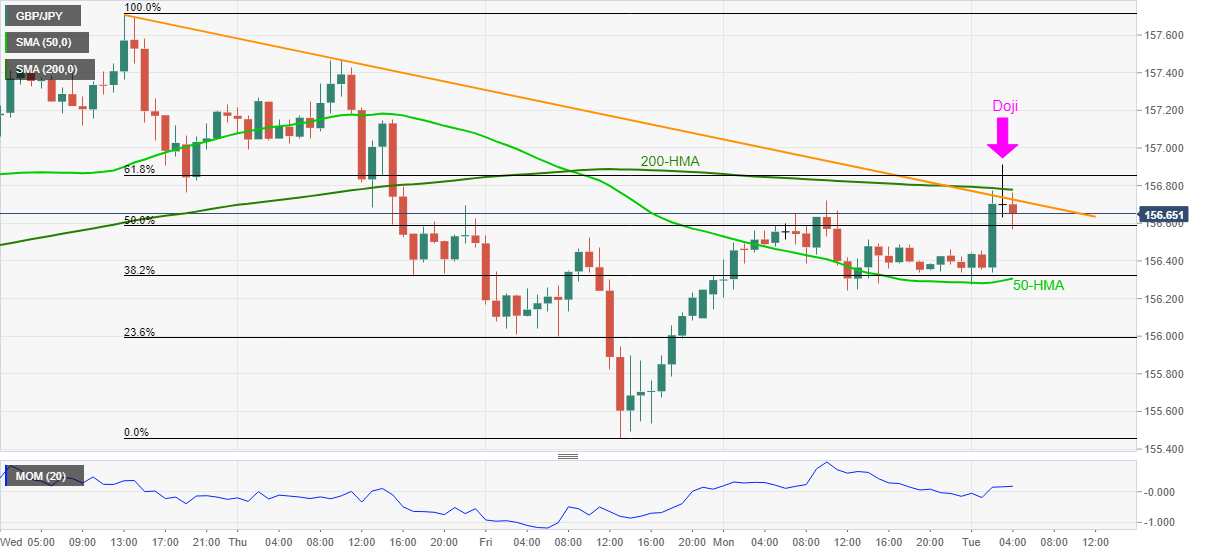
Among them, a bearish Doji candlestick below the 200-HMA and a descending resistance line from January 12, not to forget the steady Momentum line, play their roles.
That said, the GBP/JPY prices currently drop towards 50-HMA level near 156.30 while 23.6% Fibonacci retracement (Fibo.) of January 12-14 declines, near 156.00, will challenge the pair bears afterward.
In a case where the pair remains bearish past 156.00, the monthly low near 155.45 will be on the cards.
Alternatively, a clear upside break of the 200-HMA level of 156.77 will direct GBP/JPY prices towards the 157.00 threshold.
Following that, 154.45 and the monthly peak of 157.76 should lure the GBP/JPY buyers before directing them to the 2021 high near 158.22.
GBP/JPY: Hourly chart
Trend: Further declines expected
Author

Anil Panchal
FXStreet
Anil Panchal has nearly 15 years of experience in tracking financial markets. With a keen interest in macroeconomics, Anil aptly tracks global news/updates and stays well-informed about the global financial moves and their implications.


