|

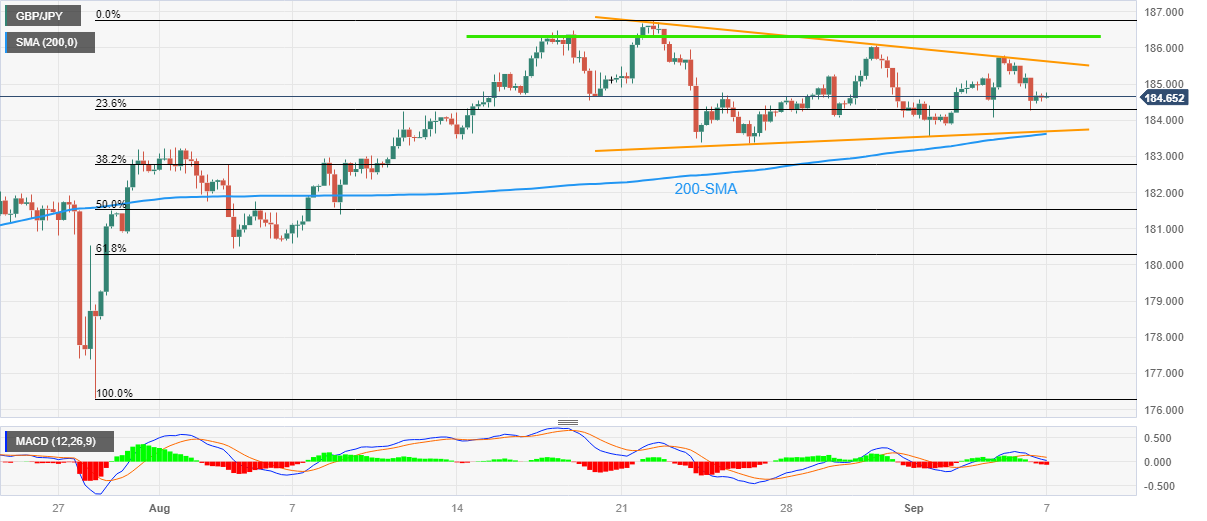
GBP/JPY Price Analysis: Pares first weekly gain in three below 185.00 within 13-day-old triangle

  • GBP/JPY lacks clear directions by sticking to mild gains as it snaps two-week downtrend.
  • Bearish MACD signals suggest further consolidation of weekly gains.
  • Convergence of 200-SMA, bottom line of the two-week-long symmetrical triangle appears a tough nut to crack for bears.

GBP/JPY treads water around 184.60 during the early hours of Thursday’s Asian session, after snapping a two-day winning streak the previous day. Even so, the cross-currency pair remains on the way to posting the first weekly gain in three as softer yields propel the Japanese Yen (JPY) despite hawkish Bank of Japan (BoJ) concerns, as well as fears of policy pivot at the Bank of England (BoE).

That said, the quote remains steady within a two-week-old symmetrical triangle but bearish MACD signals suggest further consolidation of the weekly gains, which in turn highlights the 184.00 as an immediate support to watch for the pair sellers.

However, the GBP/JPY bears should remain cautious unless they witness a clear downside break of the 183.70–60 support confluence comprising the aforementioned triangle’s bottom line and the 200-SMA.

Following that, a quick fall towards the late August swing low of around 183.35 can’t be ruled out while the early August peak of near 183.20 can prod the GBP/JPY bears afterward.

On the contrary, the 185.00 round figure guards the immediate recovery of the cross-currency pair ahead of the triangle’s top line, close to 185.65 at the latest.

Following that, a horizontal area comprising multiple levels marked since mid-August, around 186.30-35 will precede the latest peak, which is also the yearly high, of near 186.70 to challenge the GBP/JPY bulls.

GBP/JPY: Four-hour chart

Trend: Limited downside expected

Additional important levels

Overview
Today last price184.64
Today Daily Change-0.06
Today Daily Change %-0.03%
Today daily open184.7
 
Trends
Daily SMA20184.89
Daily SMA50183.1
Daily SMA100178.33
Daily SMA200170.26
 
Levels
Previous Daily High185.69
Previous Daily Low184.26
Previous Weekly High186.07
Previous Weekly Low183.54
Previous Monthly High186.77
Previous Monthly Low180.46
Daily Fibonacci 38.2%184.8
Daily Fibonacci 61.8%185.14
Daily Pivot Point S1184.08
Daily Pivot Point S2183.45
Daily Pivot Point S3182.65
Daily Pivot Point R1185.51
Daily Pivot Point R2186.31
Daily Pivot Point R3186.94

Author

Anil Panchal

Anil Panchal

FXStreet

Anil Panchal has nearly 15 years of experience in tracking financial markets. With a keen interest in macroeconomics, Anil aptly tracks global news/updates and stays well-informed about the global financial moves and their implications.

More from Anil Panchal
Share:

Markets move fast. We move first.

Orange Juice Newsletter brings you expert driven insights - not headlines. Every day on your inbox.

By subscribing you agree to our Terms and conditions.

Editor's Picks

EUR/USD could test 1.1750 amid strengthening bullish bias

EUR/USD remains flat after two days of small losses, trading around 1.1740 during the Asian hours on Thursday. On the daily chart, technical analysis indicates a strengthening of a bullish bias, as the pair continues to trade within an ascending channel pattern.

GBP/USD consolidates above mid-1.3300s as traders await BoE and US CPI report

The GBP/USD pair struggles to capitalize on the overnight bounce from the 1.3310 area, or a one-week low, and oscillates in a narrow band during the Asian session on Thursday. Spot prices currently trade around the 1.3370 region, down less than 0.10% for the day, as traders opt to wait on the sidelines ahead of the key central bank event risk and US consumer inflation data.

Gold awaits weekly trading range breakout ahead of US CPI report

Gold struggles to capitalize on the previous day's move higher back closer to the $4,350 level and trades with a mild negative bias during the Asian session on Thursday. The downtick could be attributed to some profit-taking amid a US Dollar uptick, though it is likely to remain cushioned on the back of a supportive fundamental backdrop. 

Dogecoin breaks key support amid declining investor confidence

Dogecoin trades in the red on Thursday, following a 4% decline on the previous day. The DOGE supply in profit declines as large wallet investors trim their portfolios. Derivatives data shows a surge in bearish positions amid declining retail interest.

Monetary policy: Three central banks, three decisions, the same caution

While the Fed eased its monetary policy on 10 December for the third consecutive FOMC meeting, without making any guarantees about future action, the BoE, the ECB and the BoJ are holding their respective meetings this week. 

Dogecoin Price Forecast: DOGE breaks key support amid declining investor confidence

Dogecoin (DOGE) trades in the red on Thursday, following a 4% decline on the previous day. The DOGE supply in profit declines as large wallet investors trim their portfolios. Derivatives data shows a surge in bearish positions amid declining retail interest.