GBP/JPY Price Analysis: Appears well-set to drop further towards 159.20 support
- GBP/JPY prints three-day downtrend on breaking one-week-old ascending trend line.
- Clear U-turn from the key EMA confluence, downbeat oscillators favor sellers.
- Bears approach 10-week-old upward-sloping support line but further downside appears elusive.

GBP/JPY takes offers to refresh the intraday low near 160.30 during early Friday, extending the previous two-day fall towards short-term key support.
In doing so, the cross-currency pair justifies the previous day’s downside break of a one-week-old support line, now immediate resistance near 161.25. Adding strength to the bearish bias is the quote’s reversal from a convergence of the 100-bar Exponential Moving Average (EMA) and the 200-EMA, around 161.70-80 at the latest.
It’s worth mentioning that the bearish MACD signals and an absence of oversold RSI (14) also keep the GBP/JPY sellers hopeful of witnessing the pair’s further downside.
As a result, an ascending support line from January 13, close to 159.20 by the press time, gains the major attention of the pair bears.
Following that, the monthly low of 159.56 may act as a validation point for the GBP/JPY pair’s slump toward the February low of 156.73.
On the contrary, an upside break of the support-turned-resistance line of around 161.25 will need validation from the aforementioned EMA confluence of 161.70-80 to recall the GBP/JPY buyers.
Even so, a one-month-long descending resistance line surrounding 163.00 appears crucial for the bulls to cross to retake control.
GBP/JPY: Four-hour chart
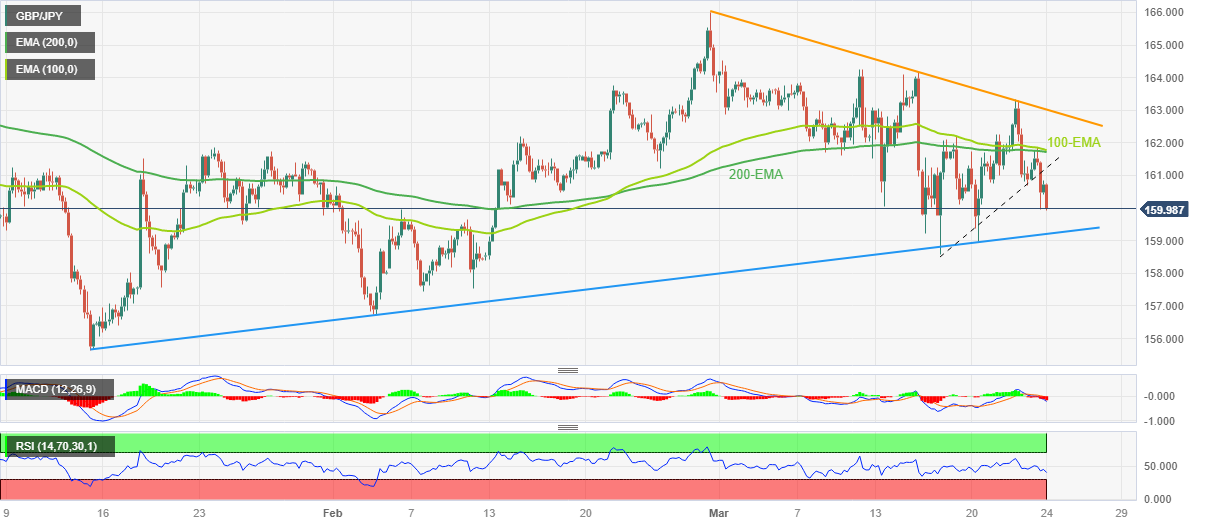
Trend: Further downside expected
Author

Anil Panchal
FXStreet
Anil Panchal has nearly 15 years of experience in tracking financial markets. With a keen interest in macroeconomics, Anil aptly tracks global news/updates and stays well-informed about the global financial moves and their implications.


