GameStop Stock Price and Forecast: GME down 2% at Wednesday open


  • GameStop loses momentum and falls 13% on Tuesday.
  • GME stock falls back to $214 and could break $200 on Wednesday.
  • Momentum names are slowing as yields rise and Thanksgiving sees profit-taking.

UPDATE: GME shares retreated 2% at the open to $208.70 on Wednesday. This is slightly more than major indices, all of which are in the red, as the S&P 500 is down 0.3% at the time of writing. This presents the very real possibility that GME will break the psychological barrier of $200 this week.

GameStop (GME) followed a sea of red in momentum names on Tuesday as so-called growth stocks slowed and momentum stalled. Volumes have been declining across a host of meme names with lower volumes in names like Rivian (RIVN), AMC, Lucid Group (LCID), and here in GameStop (GME) too. Volume is the oxygen for momentum stocks to breathe, and without it they stall and fall. Unless shorts have been totally battered like in AMC, then it just leads to a virtual standstill. 

Most stocks rallied from their lows into the last hour of regular trading on Tuesday, but GME was not one of them. It bottomed out down 13% around lunchtime and spent the rest of the day bottom-feeding with no bounce.
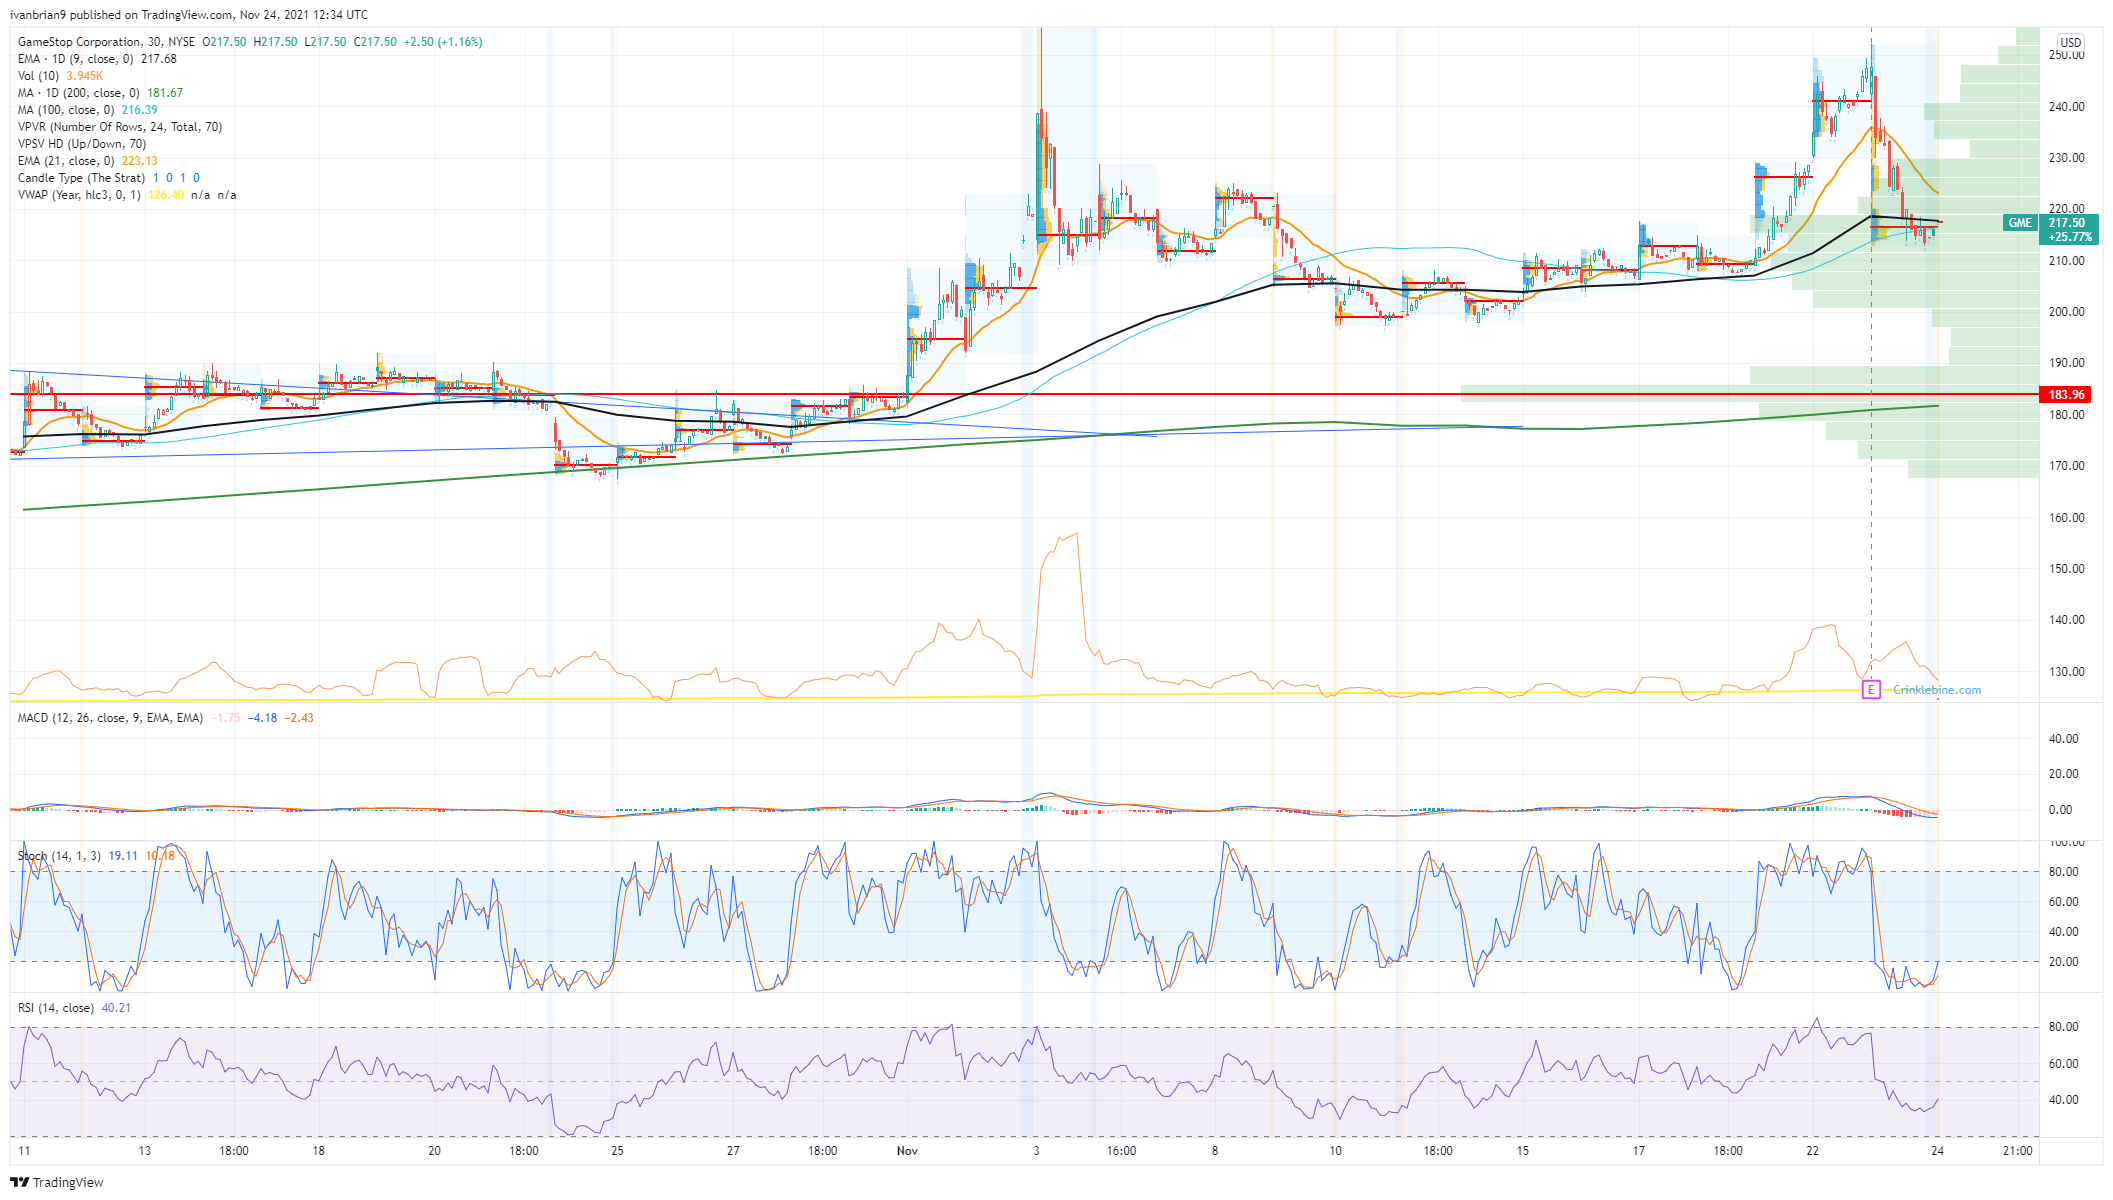
Gamestop (GME) graph, 5-minute

GameStop (GME) stock news

While the stock remains one of WallStreetBets most discussed stocks, there is little in the way of real news to explain this sharp 13% fall. Meme stocks are volatile and move without explanation. GameStop (GME) had rallied 9% on Friday and 8% on Monday, so Tuesday was just a retracement of this move. Those gains on Friday and Monday had little in the way of concrete news, so this price whipsawing around is just noise. At least there will be something concrete to dig into shortly as GameStop announced yesterday that its next quarterly earnings release will be on December 8 after the markets close. 

GameStop (GME) stock forecast

The intraday chart below shows the move up and back down, meaning we have retraced to short-term stability and high volume at $217. Below $200 is not only a psychological break but also a volume gap, meaning a sharp move to $184 would be very possible. This is the recent high volume mark going back to October.

The daily chart shows a possible double top from the most recent two spikes, and we have a matching double top in the stochastics and Relative Strength Index (RSI). Double tops are strong bearish signals. Support remains at $180 from the 200-day moving average. Breaking this double top would give us a target of $350 as it would mean the earlier triangle breakout remains on track. A triangle breakout target is the size of the entry of the triangle, which in this case is $100. Failure though at $250 means the double top is in place, and that is a pretty strong bearish signal in technical analysis terms. The target of the double top holding is $150.
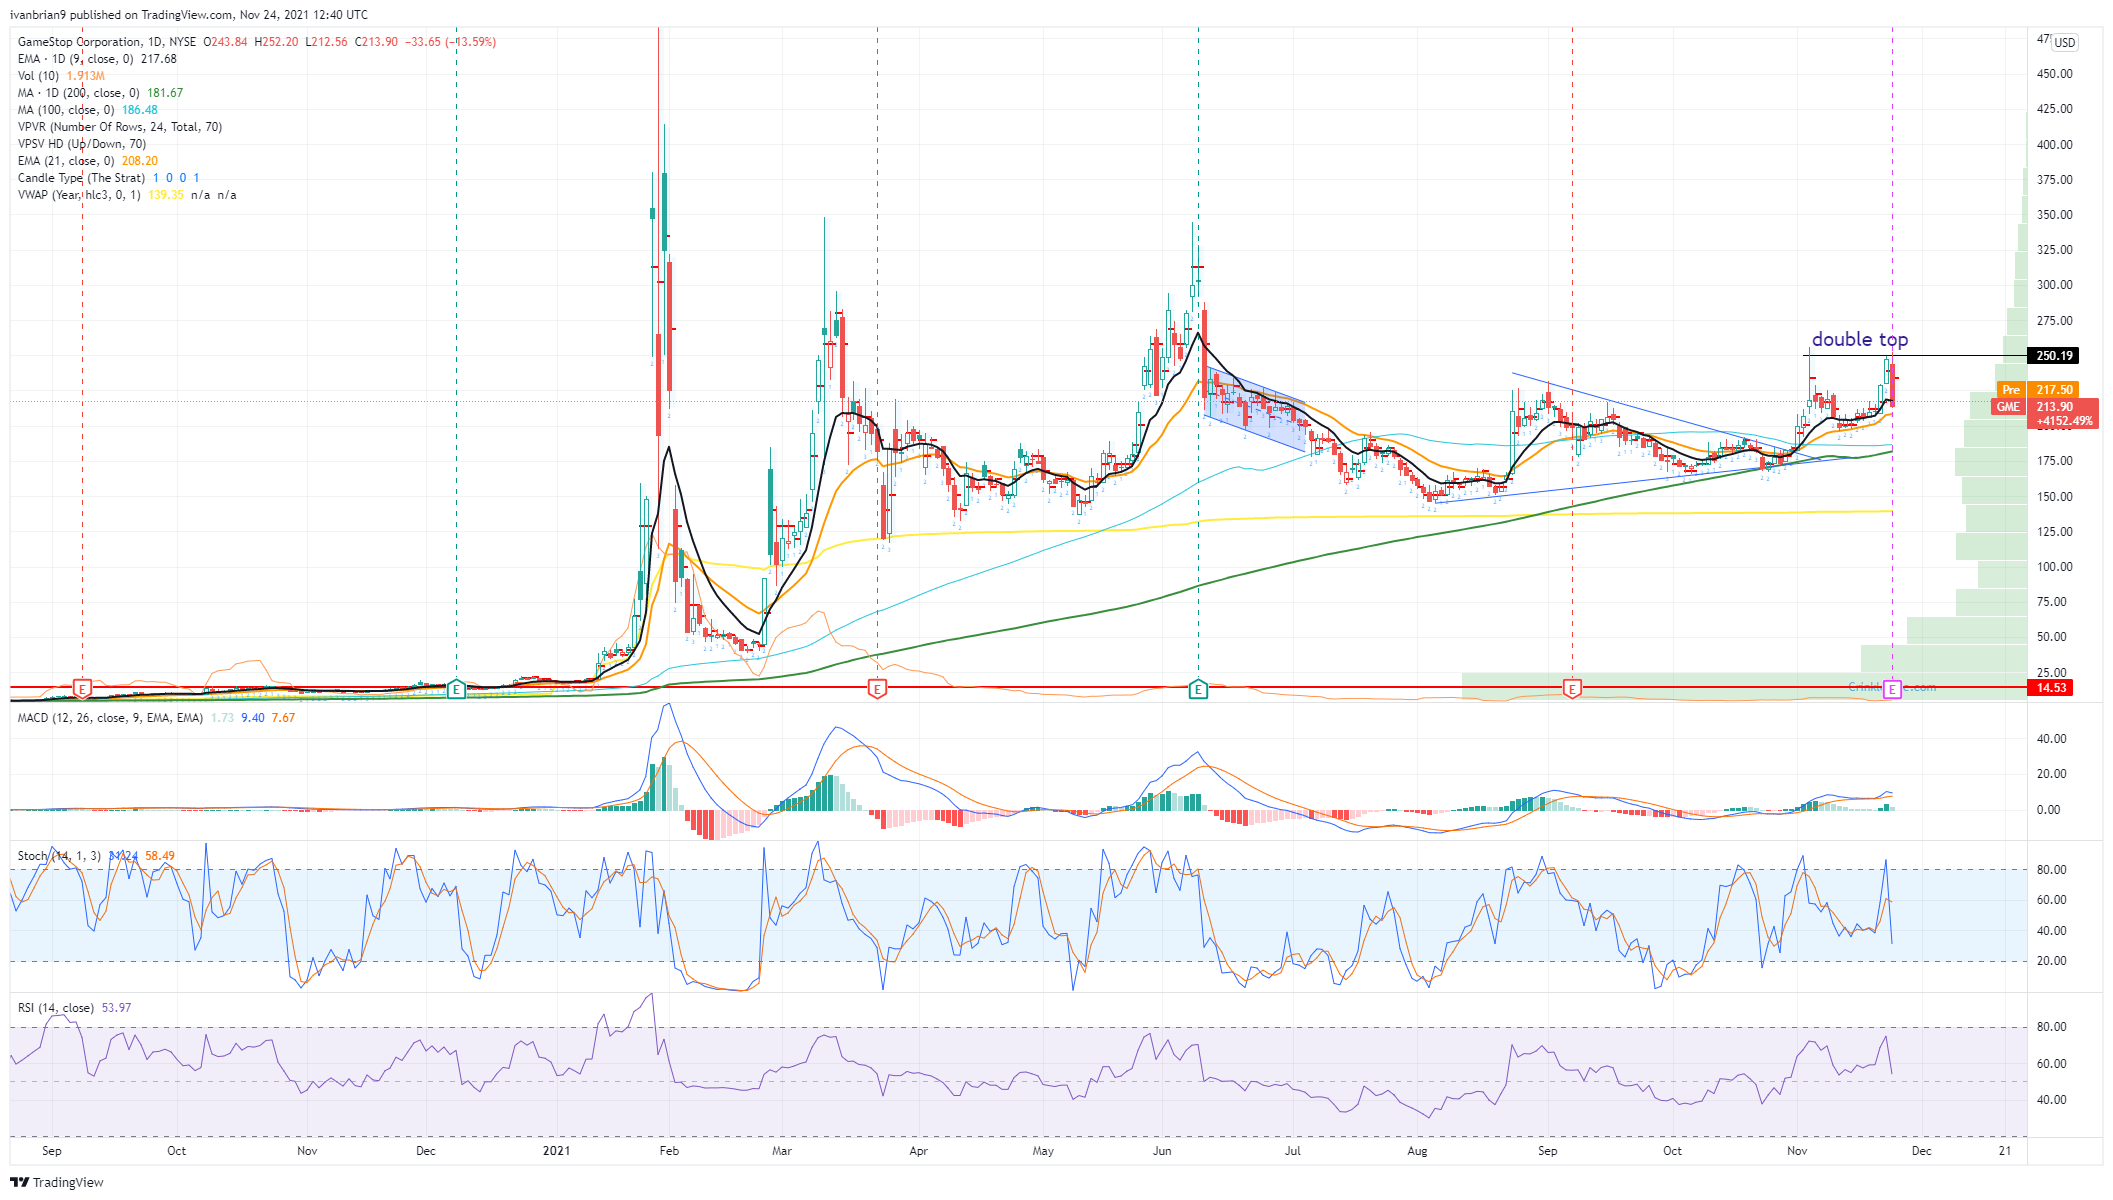
GME 1-day chart

Share: Feed news

Information on these pages contains forward-looking statements that involve risks and uncertainties. Markets and instruments profiled on this page are for informational purposes only and should not in any way come across as a recommendation to buy or sell in these assets. You should do your own thorough research before making any investment decisions. FXStreet does not in any way guarantee that this information is free from mistakes, errors, or material misstatements. It also does not guarantee that this information is of a timely nature. Investing in Open Markets involves a great deal of risk, including the loss of all or a portion of your investment, as well as emotional distress. All risks, losses and costs associated with investing, including total loss of principal, are your responsibility. The views and opinions expressed in this article are those of the authors and do not necessarily reflect the official policy or position of FXStreet nor its advertisers. The author will not be held responsible for information that is found at the end of links posted on this page.

If not otherwise explicitly mentioned in the body of the article, at the time of writing, the author has no position in any stock mentioned in this article and no business relationship with any company mentioned. The author has not received compensation for writing this article, other than from FXStreet.

FXStreet and the author do not provide personalized recommendations. The author makes no representations as to the accuracy, completeness, or suitability of this information. FXStreet and the author will not be liable for any errors, omissions or any losses, injuries or damages arising from this information and its display or use. Errors and omissions excepted.

The author and FXStreet are not registered investment advisors and nothing in this article is intended to be investment advice.

Recommended content


Recommended content

Editors’ Picks

EUR/USD edges lower toward 1.0700 post-US PCE

EUR/USD edges lower toward 1.0700 post-US PCE

EUR/USD stays under modest bearish pressure but manages to hold above 1.0700 in the American session on Friday. The US Dollar (USD) gathers strength against its rivals after the stronger-than-forecast PCE inflation data, not allowing the pair to gain traction.

EUR/USD News

GBP/USD retreats to 1.2500 on renewed USD strength

GBP/USD retreats to 1.2500 on renewed USD strength

GBP/USD lost its traction and turned negative on the day near 1.2500. Following the stronger-than-expected PCE inflation readings from the US, the USD stays resilient and makes it difficult for the pair to gather recovery momentum.

GBP/USD News

Gold struggles to hold above $2,350 following US inflation

Gold struggles to hold above $2,350 following US inflation

Gold turned south and declined toward $2,340, erasing a large portion of its daily gains, as the USD benefited from PCE inflation data. The benchmark 10-year US yield, however, stays in negative territory and helps XAU/USD limit its losses. 

Gold News

Bitcoin Weekly Forecast: BTC’s next breakout could propel it to $80,000 Premium

Bitcoin Weekly Forecast: BTC’s next breakout could propel it to $80,000

Bitcoin’s recent price consolidation could be nearing its end as technical indicators and on-chain metrics suggest a potential upward breakout. However, this move would not be straightforward and could punish impatient investors. 

Read more

Week ahead – Hawkish risk as Fed and NFP on tap, Eurozone data eyed too

Week ahead – Hawkish risk as Fed and NFP on tap, Eurozone data eyed too

Fed meets on Wednesday as US inflation stays elevated. Will Friday’s jobs report bring relief or more angst for the markets? Eurozone flash GDP and CPI numbers in focus for the Euro.

Read more

Forex MAJORS

Cryptocurrencies

Signatures