Ford Motor Company (F) Stock News and Forecast: Ford flags a breakout to target year 2000 highs above $22


  • Ford stock steady after a recent surge to 20-year highs.
  • F looks to be forming a bullish flag pattern.
  • Rivian stake is flying.

Ford (F) stock was relatively quiet on Wednesday ahead of the shortened Thanksgiving week, but the stock remains strong and looks poised to build on recent gains that have taken it to a 20-year high. Ford has a stake in Rivian (RIVN) and the huge boost in that one has helped sentiment toward the Ford stock price.

RIVN more than doubled from its IPO price at $78, and while it has given up some gains it still is trading above $110. Rivian stock is now trading with a market cap of $98 billion. Ford has a 12% stake, meaning its stake in Rivian is now a $10 billion kicker. In a sign of the current valuation twilight zone we find ourselves in, Ford is worth some $18 billion less than Rivian with a market cap of $80 billion. That is a discussion for another day.

Ford (F) stock news

Ford and Rivian recently ended plans to jointly develop an electric vehicle. Ford confirmed the news last Friday. No further details were available on the reasoning. Ford is engaged in a continuous ramping up of its own electric vehicle (EV) production as consumers increasingly pivot to EV use. Auto stocks have benefitted from the passing of President Biden's green energy plan with incentives for car manufacturers to produce increased electric vehicles. Perhaps it is less complicated for both companies to develop vehicles seperately. Both will have crossovers in their future model lineups.

The latest rally in the Ford share price from $16 to $20 was largely down to results on October 27. While revenue came in quite a bit behind estimates, $35.7 billion versus $38.2 billion expected, earnings per share (EPS) showed a big beat of $0.51 versus $0.27 expected. The forecasts of the full year 2021 were also raised and a dividend was reinstated. Ford surged 9% after earnings.

Ford (F) stock forecast

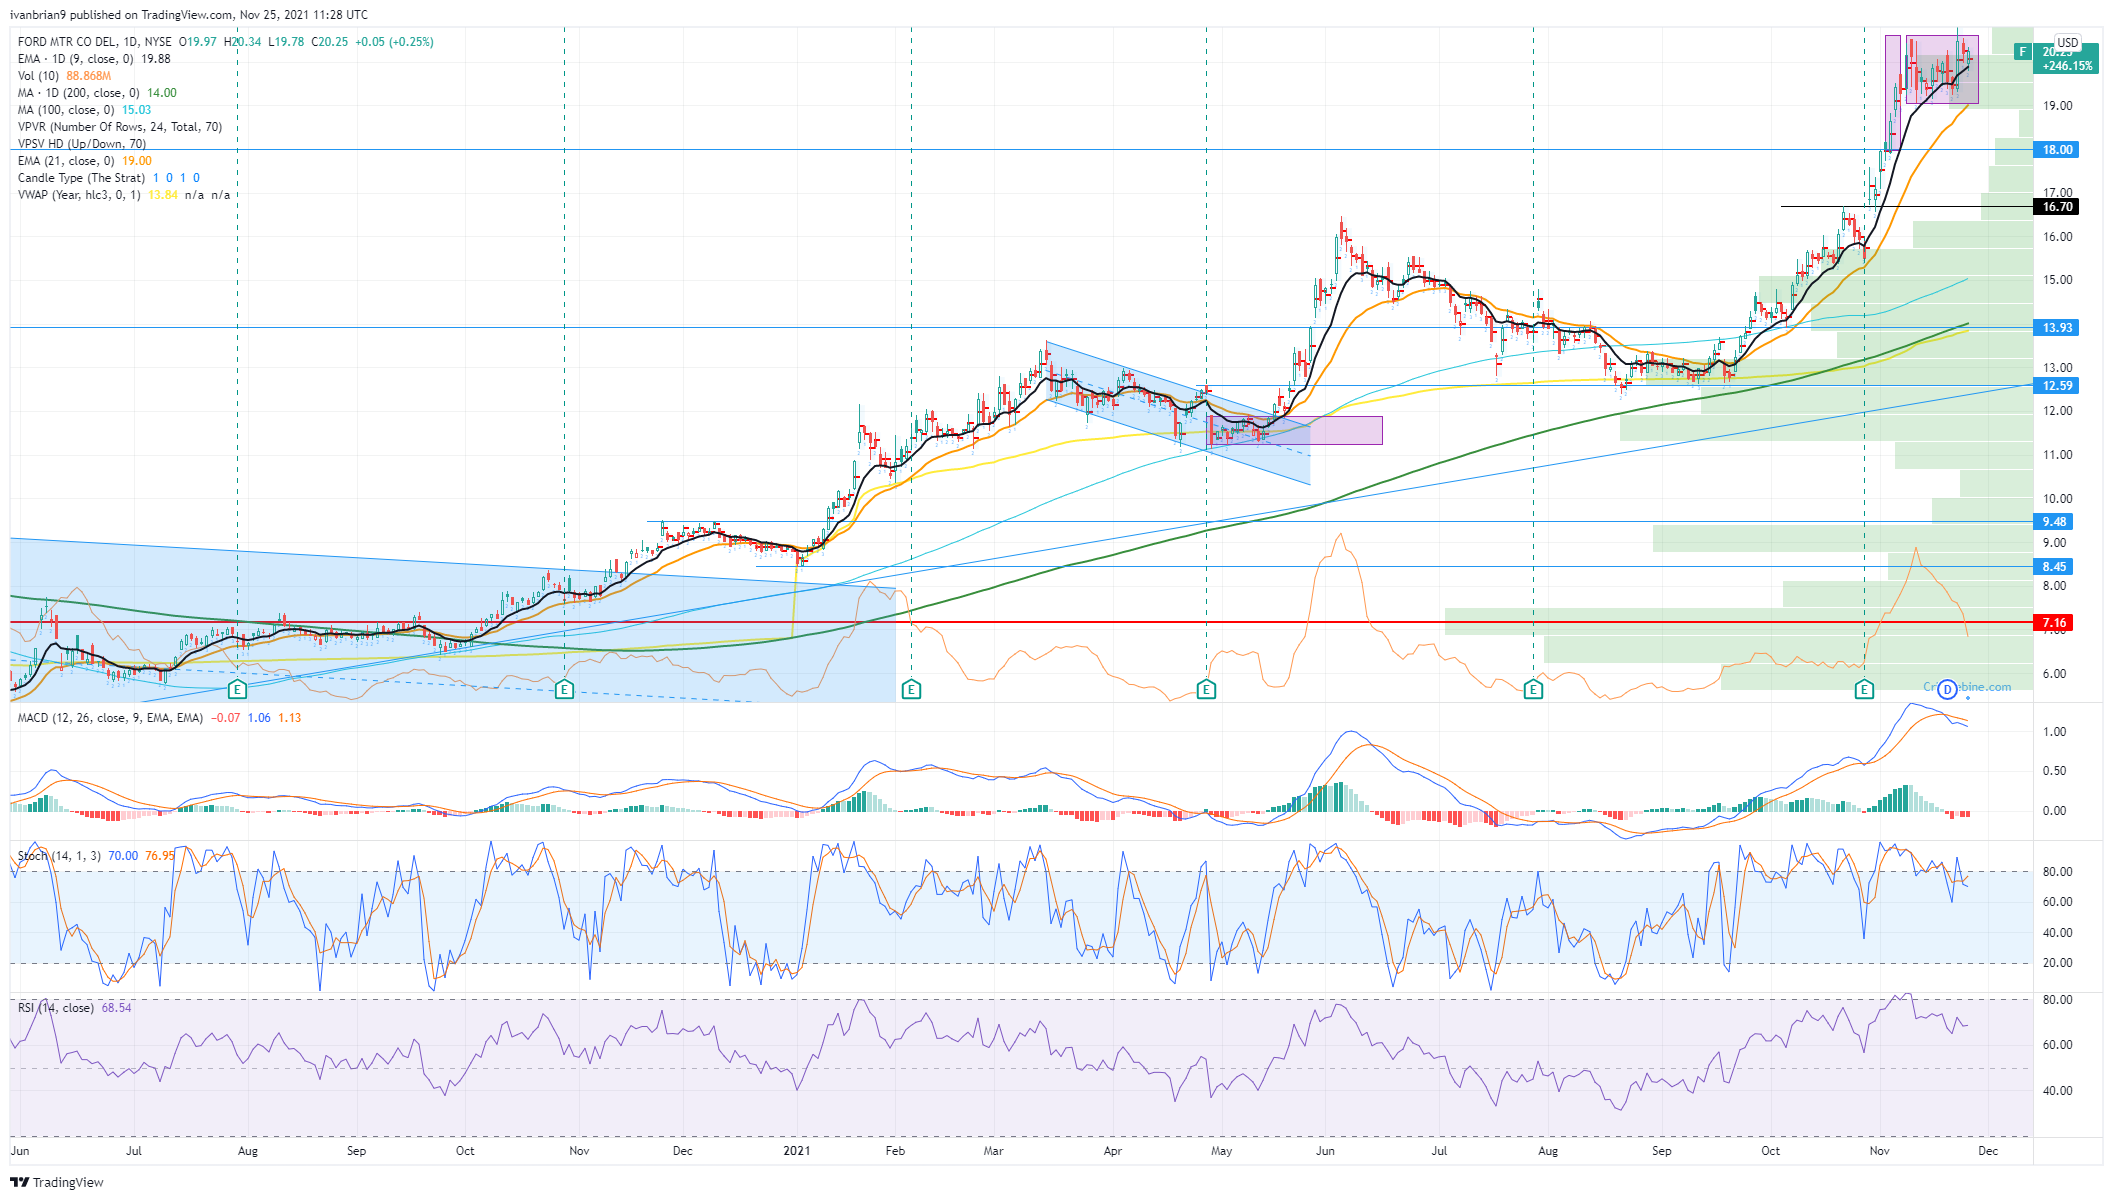
The strong move post-earnings was then added to by the successful Rivian IPO. Ford pushed on to 20-year highs above $20 and now looks to consolidate the gains from earnings. A consolidation phase is a continuation of the current trend, and the flag formed is a result of this recent price stall. Flag patterns though are usually continuation patterns. The rally is merely pausing and allowing for more price acceptance at the higher levels.

We would really like to see $18 held as this is the bottom of the flagpole and the second price explosion point. $18 is also a seven-year high and so significant in its own right. The first and other key support is at $16.70 – the earnings price explosion. These are key supports to hold the bullish trend. Breaking out of the consolidation or flag gives a target of $22 into year end. That is 10% above current levels.

The monthly chart below gives the big picture view. $22.72 is the low from all the way back to February and December of 2000 – yes, over 20 years ago. That is the next resistance and target of the flag breakout. 
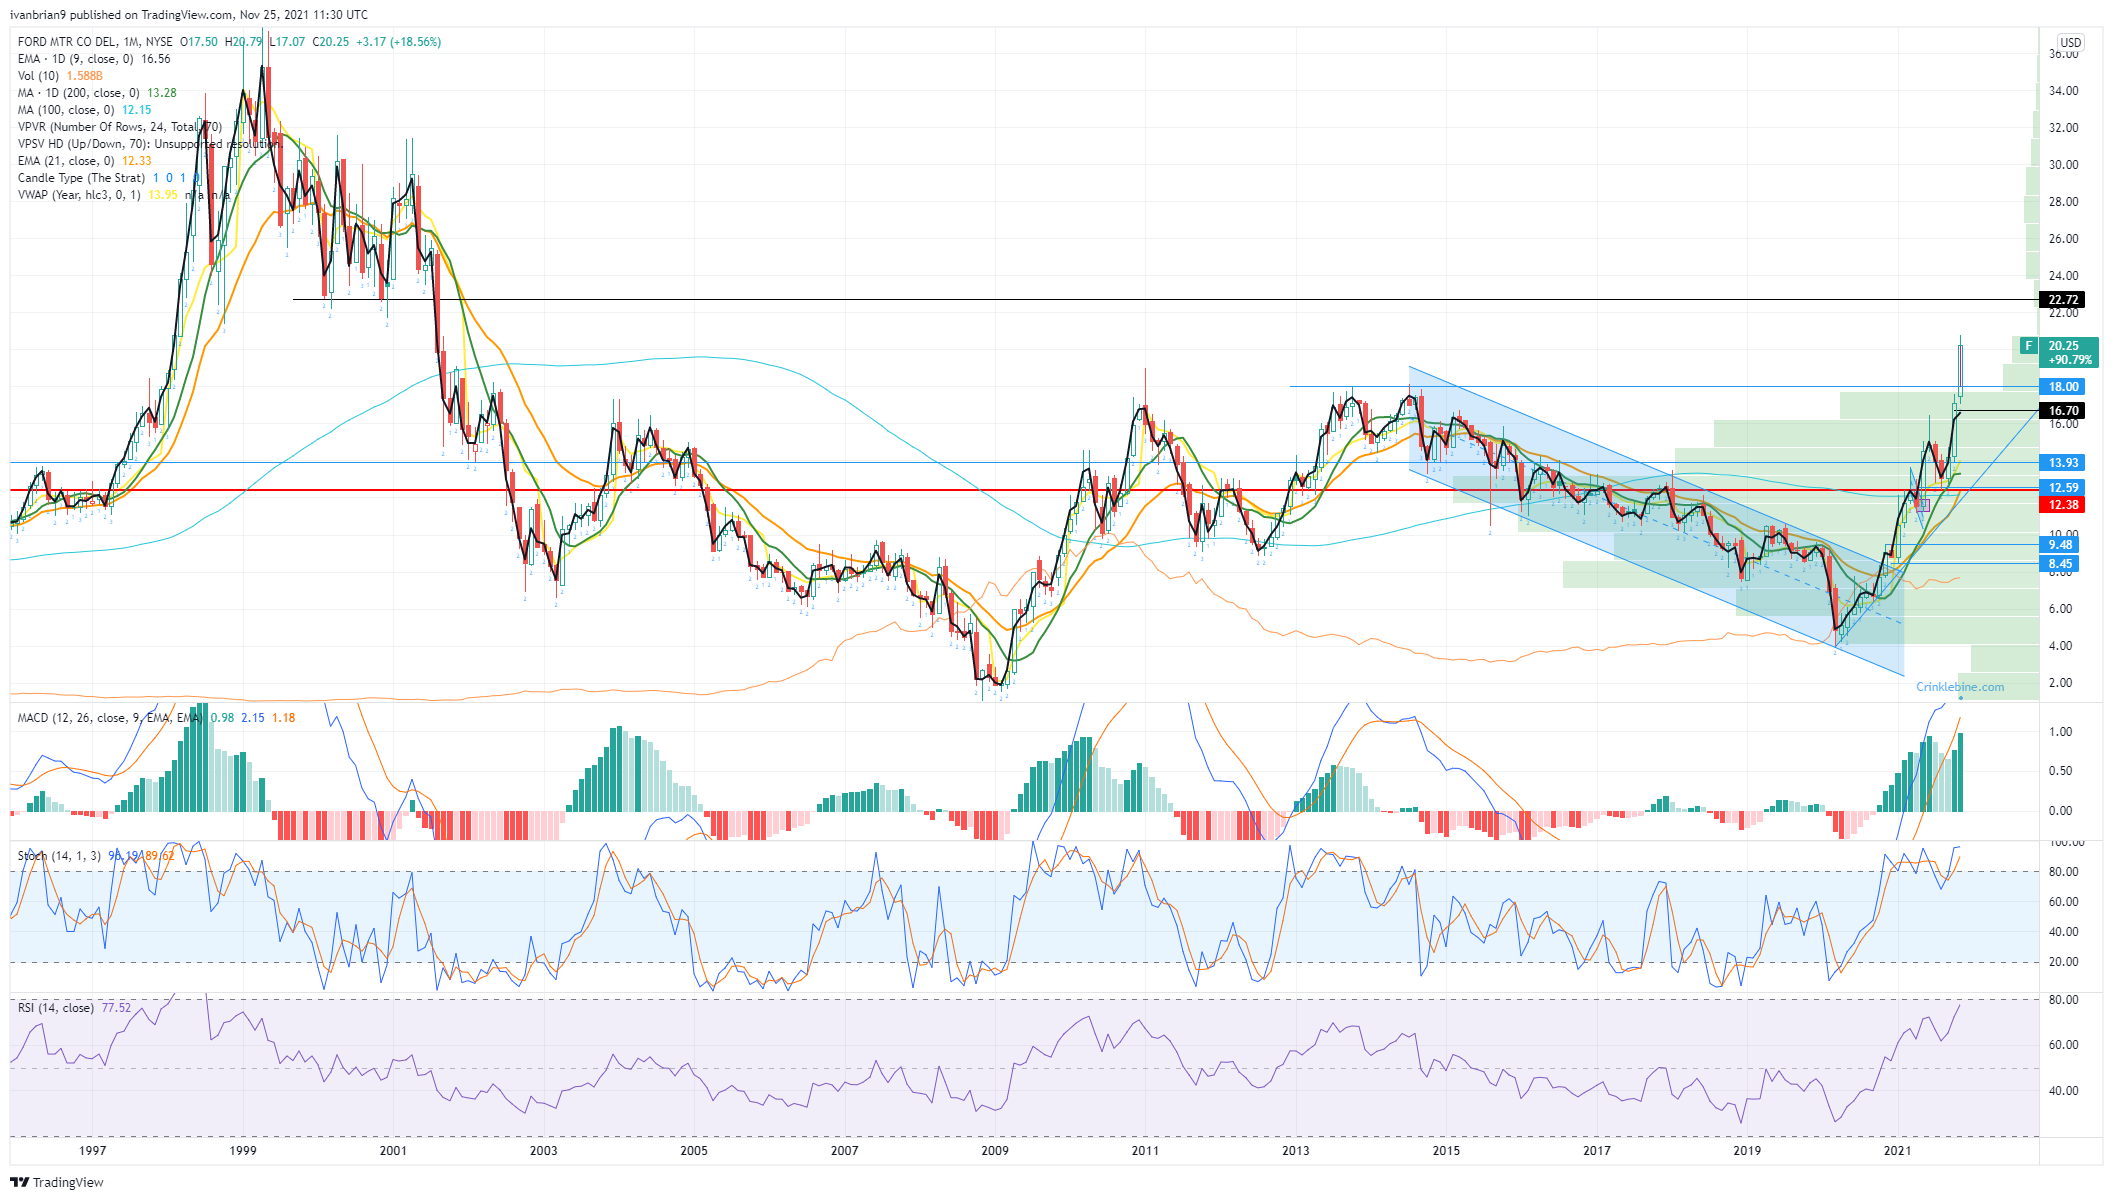
Ford 1-month chart

Share: Feed news

Information on these pages contains forward-looking statements that involve risks and uncertainties. Markets and instruments profiled on this page are for informational purposes only and should not in any way come across as a recommendation to buy or sell in these assets. You should do your own thorough research before making any investment decisions. FXStreet does not in any way guarantee that this information is free from mistakes, errors, or material misstatements. It also does not guarantee that this information is of a timely nature. Investing in Open Markets involves a great deal of risk, including the loss of all or a portion of your investment, as well as emotional distress. All risks, losses and costs associated with investing, including total loss of principal, are your responsibility. The views and opinions expressed in this article are those of the authors and do not necessarily reflect the official policy or position of FXStreet nor its advertisers. The author will not be held responsible for information that is found at the end of links posted on this page.

If not otherwise explicitly mentioned in the body of the article, at the time of writing, the author has no position in any stock mentioned in this article and no business relationship with any company mentioned. The author has not received compensation for writing this article, other than from FXStreet.

FXStreet and the author do not provide personalized recommendations. The author makes no representations as to the accuracy, completeness, or suitability of this information. FXStreet and the author will not be liable for any errors, omissions or any losses, injuries or damages arising from this information and its display or use. Errors and omissions excepted.

The author and FXStreet are not registered investment advisors and nothing in this article is intended to be investment advice.

Recommended content


Recommended content

Editors’ Picks

EUR/USD holds above 1.0700 ahead of key US data

EUR/USD holds above 1.0700 ahead of key US data

EUR/USD trades in a tight range above 1.0700 in the early European session on Friday. The US Dollar struggles to gather strength ahead of key PCE Price Index data, the Fed's preferred gauge of inflation, and helps the pair hold its ground. 

EUR/USD News

USD/JPY stays above 156.00 after BoJ Governor Ueda's comments

USD/JPY stays above 156.00 after BoJ Governor Ueda's comments

USD/JPY holds above 156.00 after surging above this level with the initial reaction to the Bank of Japan's decision to leave the policy settings unchanged. BoJ Governor said weak Yen was not impacting prices but added that they will watch FX developments closely.

USD/JPY News

Gold price oscillates in a range as the focus remains glued to the US PCE Price Index

Gold price oscillates in a range as the focus remains glued to the US PCE Price Index

Gold price struggles to attract any meaningful buyers amid the emergence of fresh USD buying. Bets that the Fed will keep rates higher for longer amid sticky inflation help revive the USD demand.

Gold News

Sei Price Prediction: SEI is in the zone of interest after a 10% leap

Sei Price Prediction: SEI is in the zone of interest after a 10% leap

Sei price has been in recovery mode for almost ten days now, following a fall of almost 65% beginning in mid-March. While the SEI bulls continue to show strength, the uptrend could prove premature as massive bearish sentiment hovers above the altcoin’s price.

Read more

US core PCE inflation set to signal firm price pressures as markets delay Federal Reserve rate cut bets

US core PCE inflation set to signal firm price pressures as markets delay Federal Reserve rate cut bets

The core PCE Price Index, which excludes volatile food and energy prices, is seen as the more influential measure of inflation in terms of Fed positioning. The index is forecast to rise 0.3% on a monthly basis in March, matching February’s increase. 

Read more

Forex MAJORS

Cryptocurrencies

Signatures