Ford (F) Stock Forecast: With highest share price in 20 years, where can Ford go next?
- Ford rises 2.3% on Thursday to $25.02, near $100 billion valuation.
- F stock price has risen 156% over the past year due to EV strategy.
- Ford shares trade at highest level in 20 years.

Ford (F) may be stuck in the throws of transistioning into an electric vehicle (EV) automaker, but it appears the market is already giving it the attendant valuation it attaches to this industry. On Thursday, Ford stock managed to reach a market cap of $100 billion mid-session before closing just below at $99.986 bilion at $25.02 per share.
Ford Stock News: highest share price in 20 years
In just a year and a half, Ford stock has gone from a maligned investment heralded by bargain basement value investors to the focus of many banks and hedge funds. Not even two years ago, shares of F were trading for as little as $3.96 at the nadir of the pandemic sell-off. Now Ford shares are at prices not seen since 2001. Yes, that is two decades ago.
Since CEO Jim Farley assumed his role on October 1, 2020, Ford stock has returned 276%. To be sure, Ford may now be worth more than main rival General Motors at $90 billion or EV truck competitor Rivian at $75 billion, but it is well below EV leader Tesla, which sports a valuation above $1 trillion. The turn in valuation appears to be entirely due to Ford's substantive focus on EVs.
“I’m proud the company is getting recognized for our commitment to electrification,” concurred Farley in an interview with Bloomberg. “The market is saying we like this Ford move into battery-electric and we have more confidence in the delivery of the base business. We like that they’re moving now to scale while others are years away.”
Ford recently announced that it would double production of its Ford F-150 Lightning, it first foray into the EV truck market. Ford said last week that it would ramp up production of its Lightning model to 150,000 units a year by 2023. The storied automaker already has 200,000 reservations for the EV truck.
Deutsche Bank has called Ford one of its top picks in the automotive sector for 2022, and CEO Farley was named MotorTrend's 2022 Person of the Year in mid-December.
Ford key statistics
| Market Cap | $100 billion |
| Price/Earnings | 31 |
| Price/Sales | 0.6 |
| Price/Book | 2.3 |
| Enterprise Value | $212 billion |
| Operating Margin | 2% |
| Profit Margin |
2% |
| 52-week high | $25.87 |
| 52-week low | $9.82 |
| Short Interest | 2% |
| Average Wall Street Rating and Price Target | Hold, $20.64 |
Ford Stock Forecast: wait for the short-term pullback
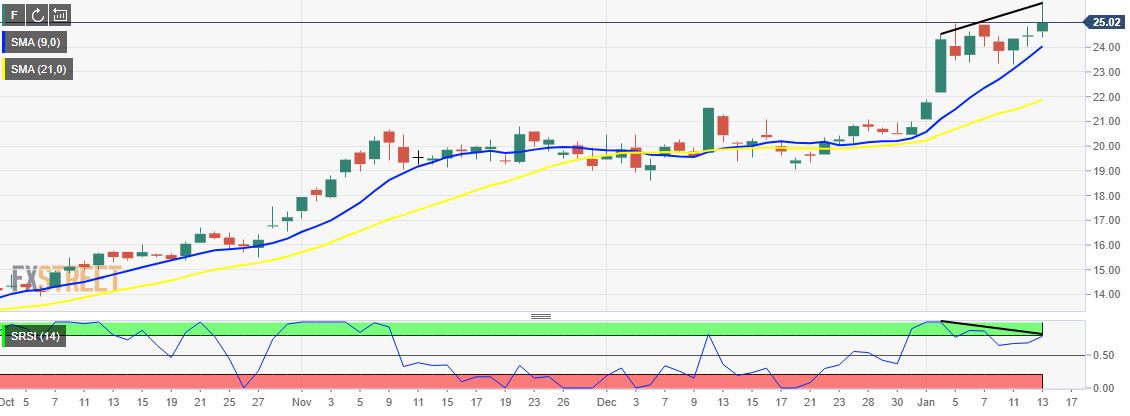
Now that you have decided to jump on the Ford bandwagon, let us give caution. Yes, the market is bullish on Ford. Yes, Ford is trading at just ten times forward earnings. The chart, however, leads us to believe a short-term pullback is ready to commence. First, look how F shares pulled back after running up to $25.87. Ford stock has faced resistance at $25 before, both on January 5 and 7.
Second, there is a divergence between the daily chart and the Relative Strength Index (RSI). Whereas the chart slopes up with the daily highs early this year, over the same time period the RSI has featured lower highs. This divergence typically means a reversal is afoot. At 78, the RSI is fairly overbought.
Short-term support sits at $23.48. Longer-term support sits at $20.68 from the double top in November and then again at $21 from December. However, Ford stock may only drop to the 21-day moving average, which currently sits at $21.88. This amounts to a 12.5% pullback and is just below the 50% Fibonacci retracement level at $22. If it does descend to these levels, then that would be the time to load up.
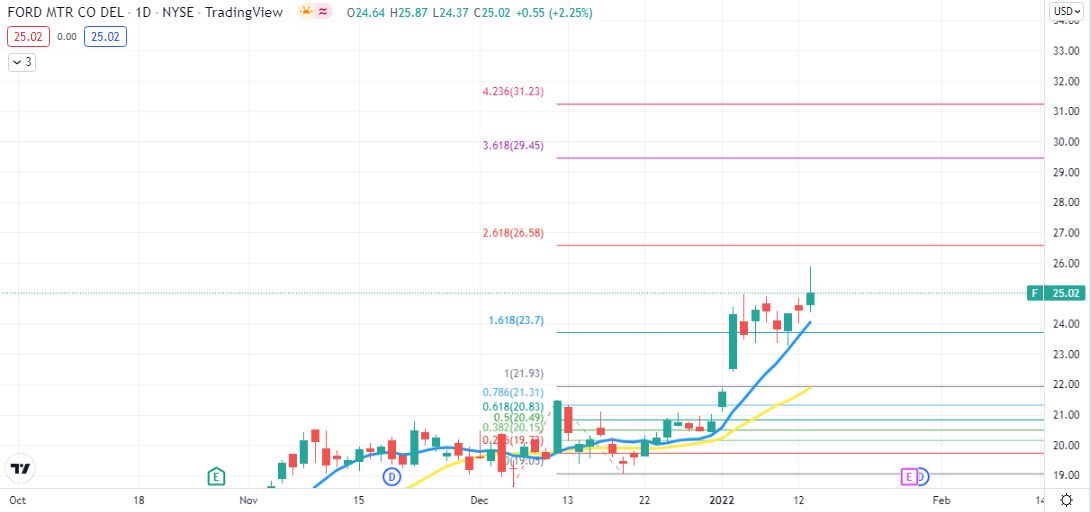
Since Ford was last at these levels in 2001, FXStreet does not think those price would have any relevence to current trends. With a volume vacuum above $25.87, the only clue are Fibonacci extension levels. Those of significance are the 261.8% Fibo at $26.58, the 361.8% Fibo at $29.45 and the 423.6% Fibo at $31.23. All of these could see action if Ford earnings in the first week of February go off with a smash.
Ford 1-day chart
Like this article? Help us with some feedback by answering this survey:
Premium
You have reached your limit of 3 free articles for this month.
Start your subscription and get access to all our original articles.
Author

Clay Webster
FXStreet
Clay Webster grew up in the US outside Buffalo, New York and Lancaster, Pennsylvania. He began investing after college following the 2008 financial crisis.


